. 2019 Aug 27;8:e46754. doi: 10.7554/eLife.46754

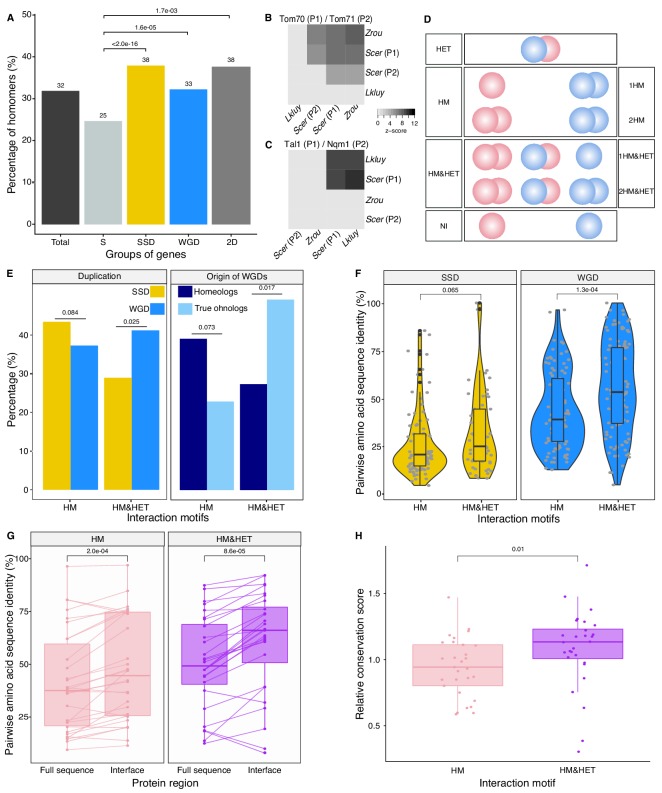
Figure 2. Homomers and heteromers of paralogs are frequent in the yeast protein interaction network.

(A) The percentage of homomeric proteins in S. cerevisiae varies among singletons (S, n = 2521 tested), small-scale duplicates (SSDs, n = 2547 tested), whole-genome duplicates (WGDs, n = 866 tested) and genes duplicated by the two types of duplication (2D, n = 136 tested) (global Chi-square test: p-value<2.2e-16). Each category is compared with the singletons using a Fisher’s exact test. P-values are reported on the graph. (B and C) Interactions between S. cerevisiae paralogs and pre-whole-genome duplication orthologs using DHFR PCA. The gray tone shows the PCA signal intensity converted to z-scores. Experiments were performed in S. cerevisiae. Interactions are tested among: (B) S. cerevisiae (Scer) paralogs Tom70 (P1) and Tom71 (P2) and their orthologs in Lachancea kluyveri (Lkluy, SAKL0E10956g) and in Zygosaccharomyces rouxii (Zrou, ZYRO0G06512g) and (C) S. cerevisiae paralogs Tal1 (P1) and Nqm1 (P2) and their orthologs in L. kluyveri (Lkluy, SAKL0B04642g) and in Z. rouxii (Zrou, ZYRO0A12914g). (D) Paralogs show six interaction motifs that we grouped in four categories according to their patterns. HET pairs show heteromers only. HM pairs show at least one homomer (one for 1HM or two for 2HM). HM&HET pairs show at least one homomer (one for 1HM&HET or two for 2HM&HET) and the heteromer. NI (non-interacting) pairs show no interaction. We focused our analysis on pairs derived from an ancestral HM, which we assume are pairs showing the HM and HM&HET motifs. (E) Percentage of HM and HM&HET among SSDs (202 pairs considered, yellow) and WGDs (260 pairs considered, blue) (left panel), homeologs that originated from inter-species hybridization (47 pairs annotated and considered, dark blue) (right panel) and true ohnologs from the whole-genome duplication (82 pairs annotated and considered, light blue). P-values are from Fisher’s exact tests. (F) Percentage of pairwise amino acid sequence identity between paralogs for HM and HM&HET motifs for SSDs and WGDs. P-values are from Wilcoxon tests. (G) Pairwise amino acid sequence identity for the full sequences of paralogs and their binding interfaces for the two motifs HM and HM&HET. P-values are from paired Wilcoxon tests. (H) Relative conservation scores for the two motifs of paralogs. Conservation scores are the percentage of sequence identity at the binding interface divided by the percentage of sequence identity outside the interface. Data shown include 30 interfaces for the HM group and 28 interfaces for the HM&HET group (22 homomers and 3 heterodimers of paralogs) (Supplementary file 2 Table S13). P-value is from a Wilcoxon test.

Figure 2.

Figure 2—figure supplement 1. Association between mRNA abundance and the probability of HM detection by PCA in this study.
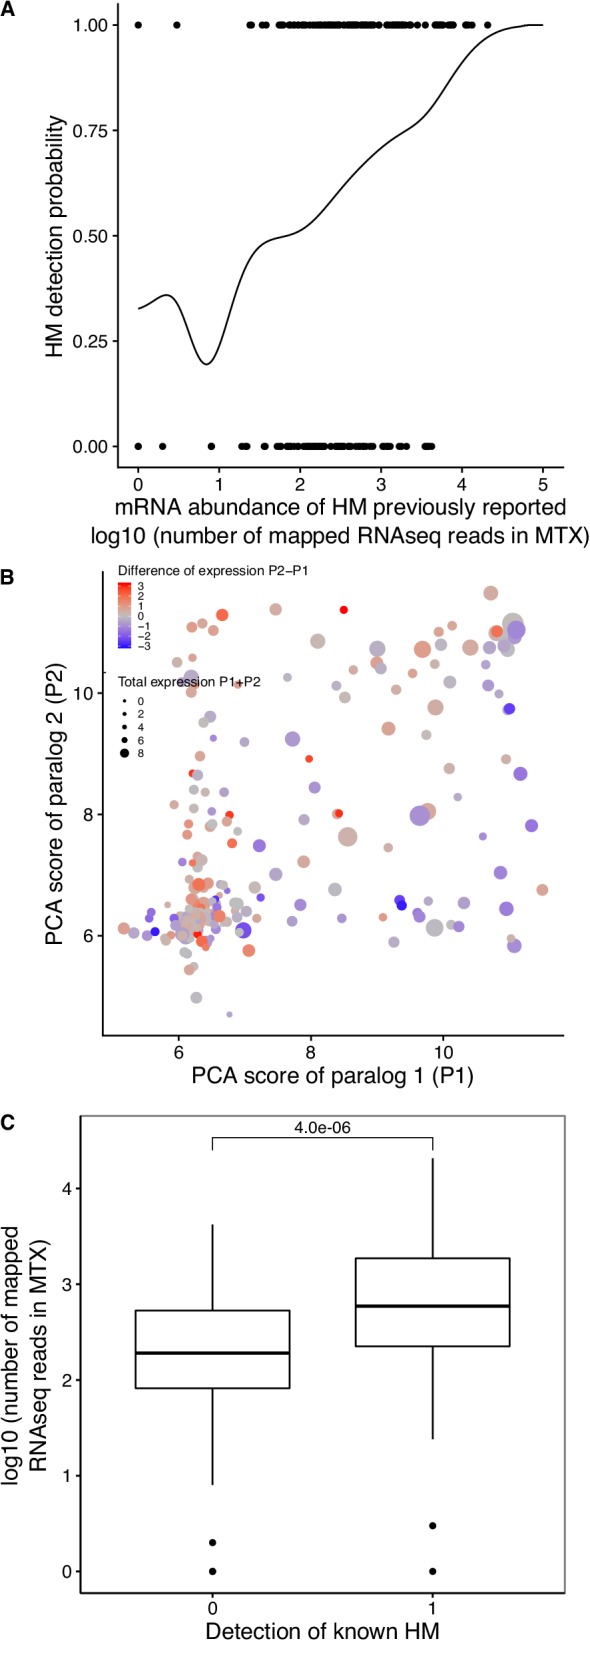
Figure 2—figure supplement 1.

(A) The probability that PCA detects a HM is correlated with expression level, as estimated by RNAseq. The plot shows the detection probability of HMs as a function of mRNA abundance for previously reported HMs. Kernel regression of the HM detection (one for detected, 0 for not detected) on the number of mapped reads per gene (log10). (B) Difference in HM formation between paralogs results in part from their differential mRNA abundance. The PCA score of paralog 1 (P1) is compared to the PCA score of paralog 2 (P2). PCA scores are median colony sizes from the PCA experiments performed in this study. The total mRNA abundance of paralogs is shown by the size of the points and the difference of expression levels is represented by a color gradient (red for overexpression of P2 compared to P1 and blue overexpression of P1 compared to P2). Red points tend to be above the diagonal, blue points, below the diagonal. (C) Comparison of expression levels of previously reported HMs for HMs undetected and detected in the PCA experiments performed in this study. P-value from a Wilcoxon test is shown.
Figure 2—figure supplement 2. mRNA and protein abundance of singletons and duplicates.

Figure 2—figure supplement 2.

(A) Comparison of mRNA abundance of genes as a function of whether they rare duplicated and of their type of duplication. (B) Comparison of the protein abundance as a function of whether they rare duplicated and their type of duplication. (S: singleton, SSD: Small-Scale Duplicates, WGD: Whole-Genome Duplicates). Numbers indicate p-values from Wilcoxon tests.
Figure 2—figure supplement 3. Comparison of PCA data generated in this study with published data.
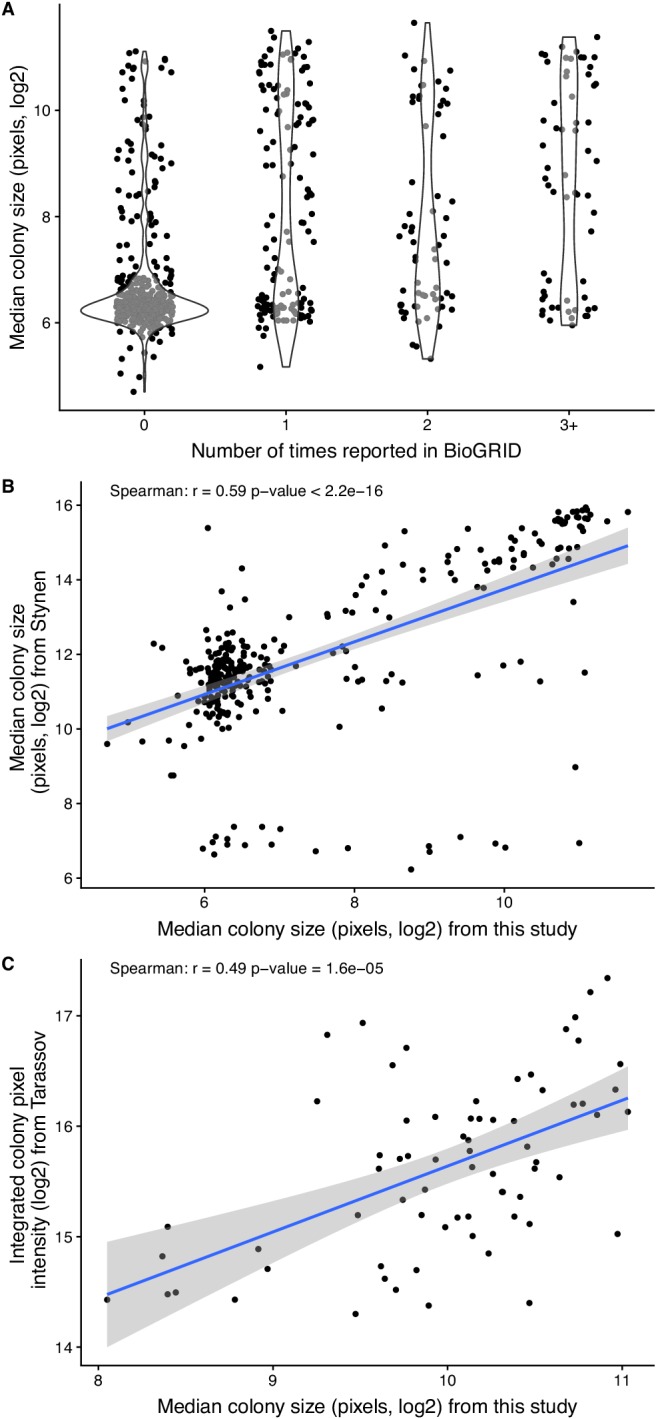
Figure 2—figure supplement 3.

(A) Colony size (estimated as the integrated pixel intensity) in the PCA experiment as a function of the number of times the corresponding interaction is reported in BioGRID version BIOGRID-3.5.166 (Chatr-Aryamontri et al., 2013; Chatr-Aryamontri et al., 2017). (B) Correlation between colony size of the study of Stynen et al. (2018) on homomers and of the PCA experiment performed in this study. (C) Correlation between colony size of Tarassov et al. (2008) and of the PCA experiment performed in this study.
Figure 2—figure supplement 4. Intersections of detected HMs.

Figure 2—figure supplement 4.

(A) and HETs (B) from this study and previously reported HMs and HETs. We considered HMs and HETs reported in crystal structures from the Protein Data Bank on September 21st, 2017 (Berman et al., 2000) and by PCA based on fluorescent proteins (BiFC) (Kim et al., 2019). We also include HMs and HETs reported in BioGRID (BIOGRID-3.5.166; Chatr-Aryamontri et al., 2013; Chatr-Aryamontri et al., 2017) with these methods: Affinity Capture-MS, Affinity Capture-Western, Reconstituted Complex, Two-hybrid, Biochemical Activity, Co-crystal Structure, Far Western, FRET, Protein-peptide, Affinity Capture-Luminescence and PCA. We added data from Stynen et al. (2018) to the BioGRID PCA data. Results of the PCA experiments from this study are highlighted in red. Turquoise-blue bars show HMs and HETs detected in this study and previously observed. The intersections were computed and plotted using the R package UpSetR (Lex et al., 2014).
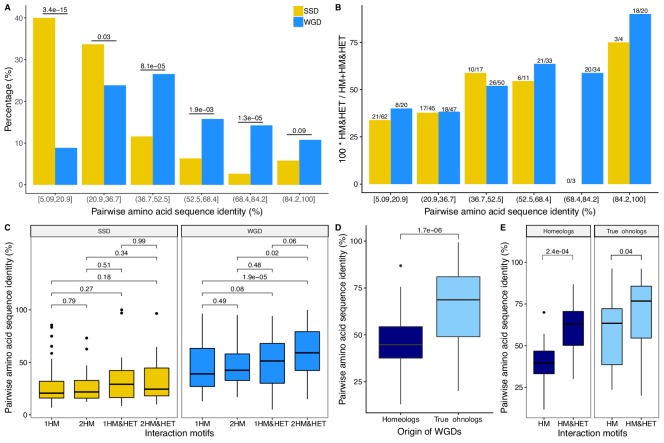
Figure 2—figure supplement 5. Interaction motifs and percentage of pairwise amino acid sequence identity between paralogs.

Figure 2—figure supplement 5.

(A) Pairs of paralogs were clustered in six pairwise amino acid sequence identity groups and the distribution (in percentage) of these groups were compared between SSD and WGD. P-values are from Fisher’s exact tests. (B) The percentage of paralog pairs forming HM&HET among the total number of paralog pairs forming at least one HM (HM and HM&HET) is shown as a function of the percentage of pairwise amino acid sequence identity (SSDs in yellow and WGDs in blue). For each group, the number of HM&HET pairs and the total number are indicated above the bars. (C) Percentage of pairwise amino acid sequence identity between paralogs for each motif. 1HM: shows one homomer only, 2HM: shows both homomers, 1HM&HET: shows one homomer and the heteromer, and 2HM&HET: shows both homomers and the heteromer. P-values are from Wilcoxon tests. (D) The percentage of pairwise amino acid sequence identity among homeologs (dark blue) and true onhologs (light blue). P-value is from a Wilcoxon test. (E) Percentage of pairwise amino acid sequence identity between paralogs for HM and HM&HET motifs for homeologs and true ohnologs. P-values are from Wilcoxon tests.
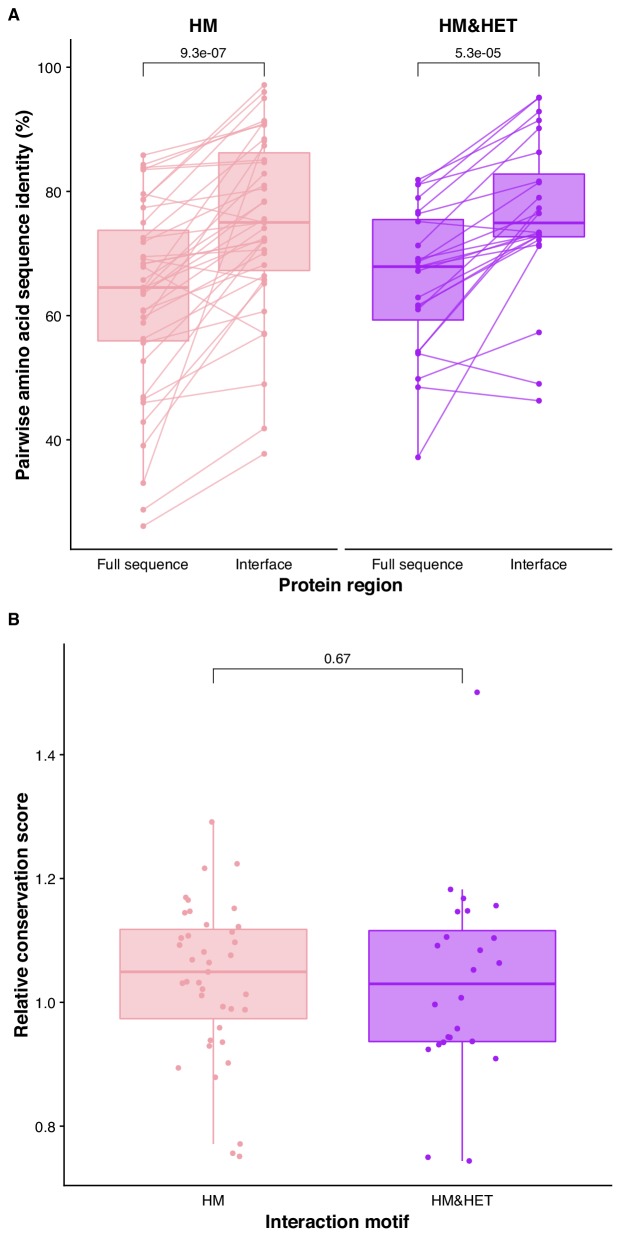
Figure 2—figure supplement 6. Conservation of binding interfaces of human paralogs in HM&HET complexes with solved structures.

Figure 2—figure supplement 6.

(A) Pairwise amino acid sequence identity for the full sequences of paralogs and their interfaces are shown for the two motifs). P-values from paired Wilcoxon tests are shown. (B) Relative conservation scores are shown for the two motifs of paralogs. Relative conservation scores are calculated based on the protein regions solved by crystallography as the percentage of sequence identity at the binding interface divided by the percentage of sequence identity outside the interface. Paralog pairs were classified as HM or HM&HET according to the dataset compiled in Supplementary file 2 Table S14. Homologous interfaces were identified in alignments of the paralogous sequences. Supplementary file 2 Table S13 contains the list of PDB IDs used for these analyses, which include 40 interfaces from homomeric structures for the HM group and 25 interfaces for the HM&HET group (24 homomers and 1 heterodimer of paralogs). P-value is from a Wilcoxon test.
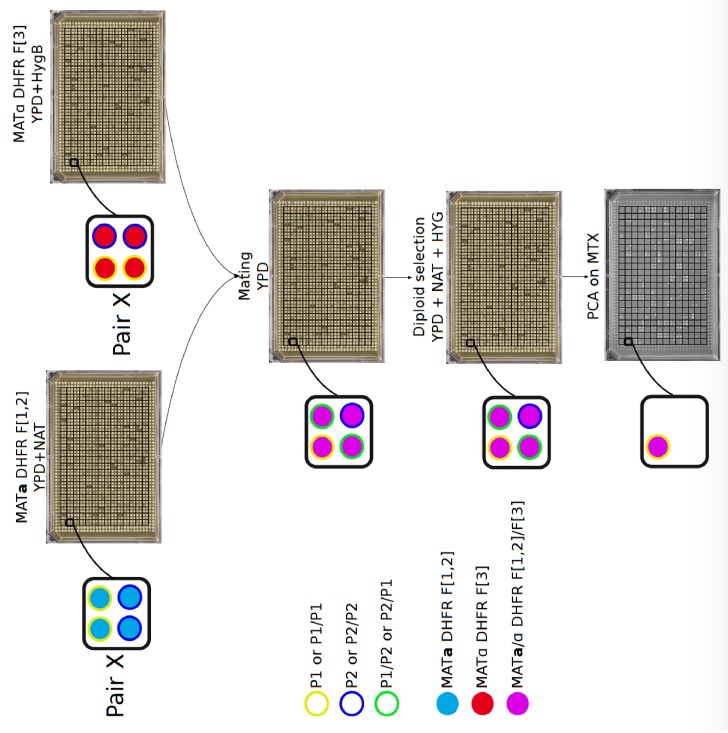
Figure 2—figure supplement 7. Plate organization for DHFR PCA experiments.

Figure 2—figure supplement 7.

On the haploid arrays (MATa and MATα), each plate has two rows and two columns of control strains at the border (blue lines). Paralogs of a pair are positioned in blocks of four strains. A given pair (example here of pair X) occupies the same position in the MATa and MATα plates. Inside a square, paralogs are positioned horizontally in MATa DHFR F[1,2] plates (P1 are at the top and P2 at the bottom of the square) while they are vertically positioned in MATα DHFR F[3] plates (P1 are at the left and P2 at the right of the square). The two haploid plates were printed on top of each other on a mating plate, generating the following crosses: P1-DHFR F[1,2]/P1 DHFR F[3] at top left, P1-DHFR F[1,2]/P2 DHFR F[3] at top right, P2-DHFR F[1,2]/P1 DHFR F[3] at bottom left and P2-DHFR F[1,2]/P2 DHFR F[3] at bottom right. Two diploid selections and two replications on MTX medium were performed.
Figure 2—figure supplement 8. Density of colony size converted to z-score.
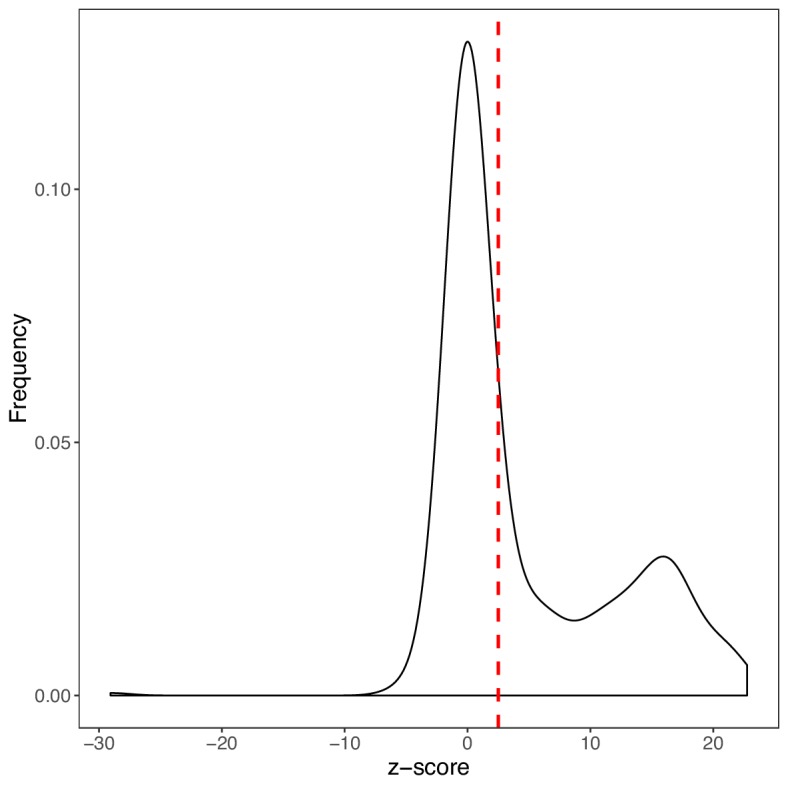
Figure 2—figure supplement 8.

Colony sizes from the PCA experiment of this study were converted to z-score using the mean (μb) and standard deviation (sdb) of the background distribution (Zs = (Is - μb)/sdb)). The density of z-scores is shown in black. A protein-protein interaction was considered as detected if the corresponding z-score was larger than 2.5 (red dashed line).