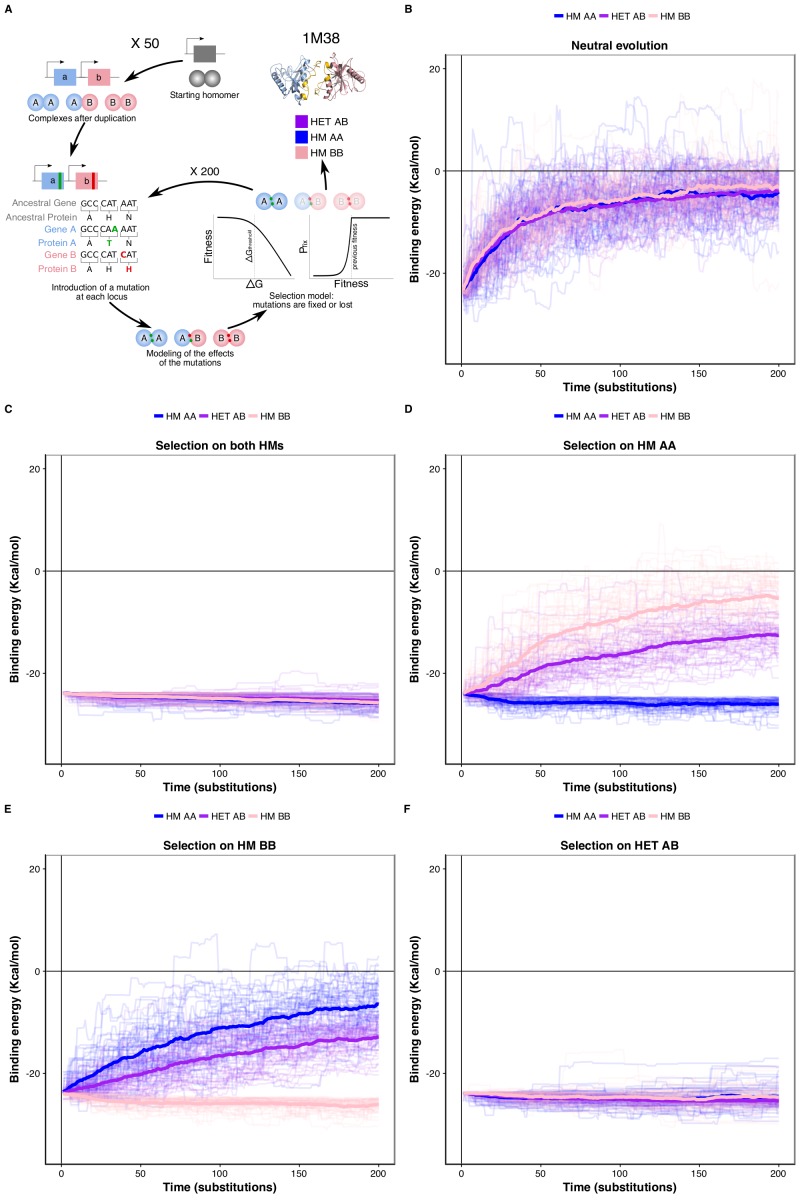
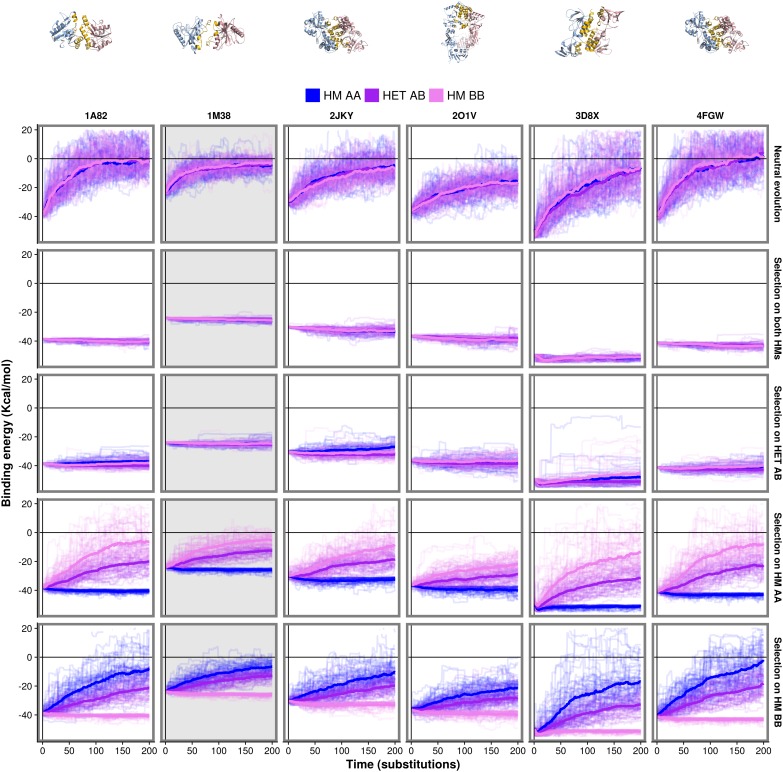
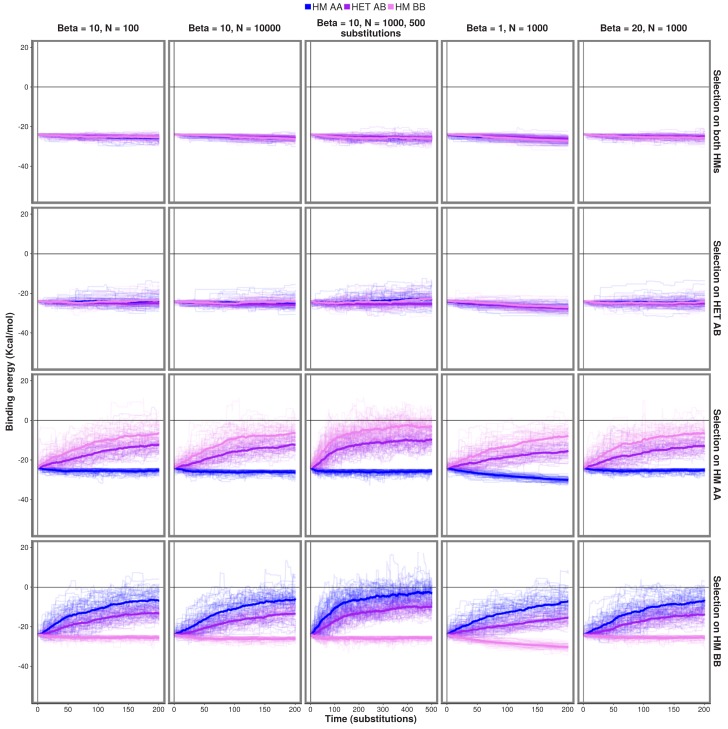
Figure 4. Negative selection to maintain homomers also maintains heteromers.
(A) The duplication of a gene encoding a homomeric protein and the evolution of the complexes is simulated by applying mutations to the corresponding subunits A and B. Only mutations that would require a single nucleotide change are allowed. Stop codons are disallowed. After introducing mutations, the selection model is applied to complexes and mutations are fixed or lost. (B to F) The binding energy of the HMs and the HET resulting from the duplication of a HM (PDB: 1M38) is followed through time under different selection regimes applied on protein stability and binding energy. More positive values indicate less favorable binding and more negative values indicate more favorable binding. (B) Accumulation and neutral fixation of mutations. (C) Selection on both HMs while the HET evolves neutrally. (D) Selection on HM AA or (E) HM BB: selection maintains one HM while the HET and the other HM evolve neutrally. (F) Selection on HET while the HMs evolve neutrally. (E) Selection on HM AA or (F) HM BB: selection maintains one HM while the HET and the other HM evolve neutrally. Mean binding energies among replicates are shown in thick lines and the individual replicates are shown with thin lines. Fifty replicate populations are monitored in each case and followed for 200 substitutions. PDB structure 1M38 was visualized with PyMOL (Schrödinger LLC, 2015). The number of substitutions that are fixed on average during the simulations are shown in Supplementary file 2 Table S8.
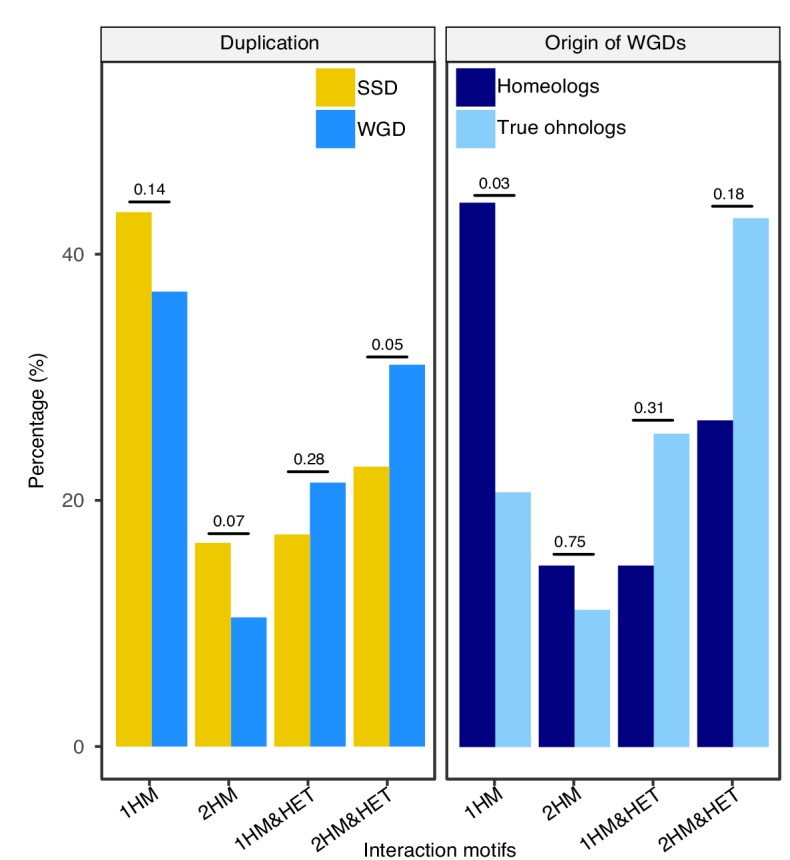
Figure 4—figure supplement 1. Percentage of interaction motifs for SSDs, WGDs and the two types of WGDs.
