. 2019 Aug 27;8:e46754. doi: 10.7554/eLife.46754

Figure 5. Epistasis favors the maintenance of HETs and the loss of HMs.

(A and B) Observed effects of double mutants on HET (y-axis) are compared to their expected effects (x-axis) based on the average of their effects on the HMs when selection is applied on both HMs (n = 6777 pairs of mutations) (A) or on the HET (n = 6760 pairs of mutations) (B). Dashed lines indicate the diagonal for perfect agreement between observations and expectations (no epistasis), black regression lines indicate the best fit for the lost mutants, and red regression lines indicate the best fit for the fixed mutants. Data were obtained from simulations with PDB structure 1M38. The regression coefficients, intercepts and R2 values are indicated on the figure for fixed and lost mutations. A regression coefficient lower than one means that pairs of mutations have a less destabilizing effects on the HET than expected based on their average effects on the HMs.

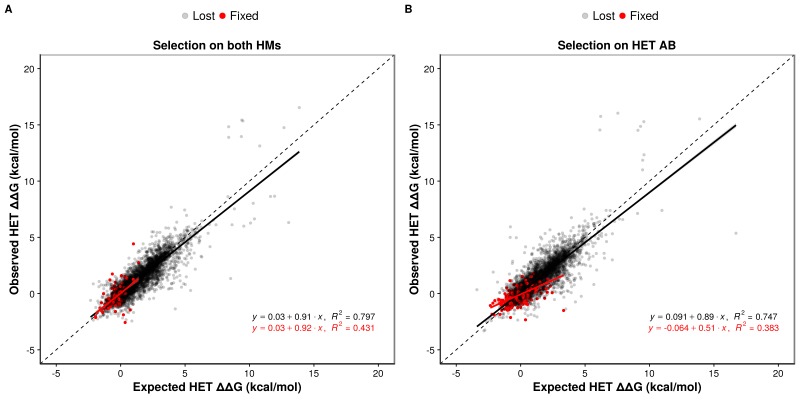
Figure 5.

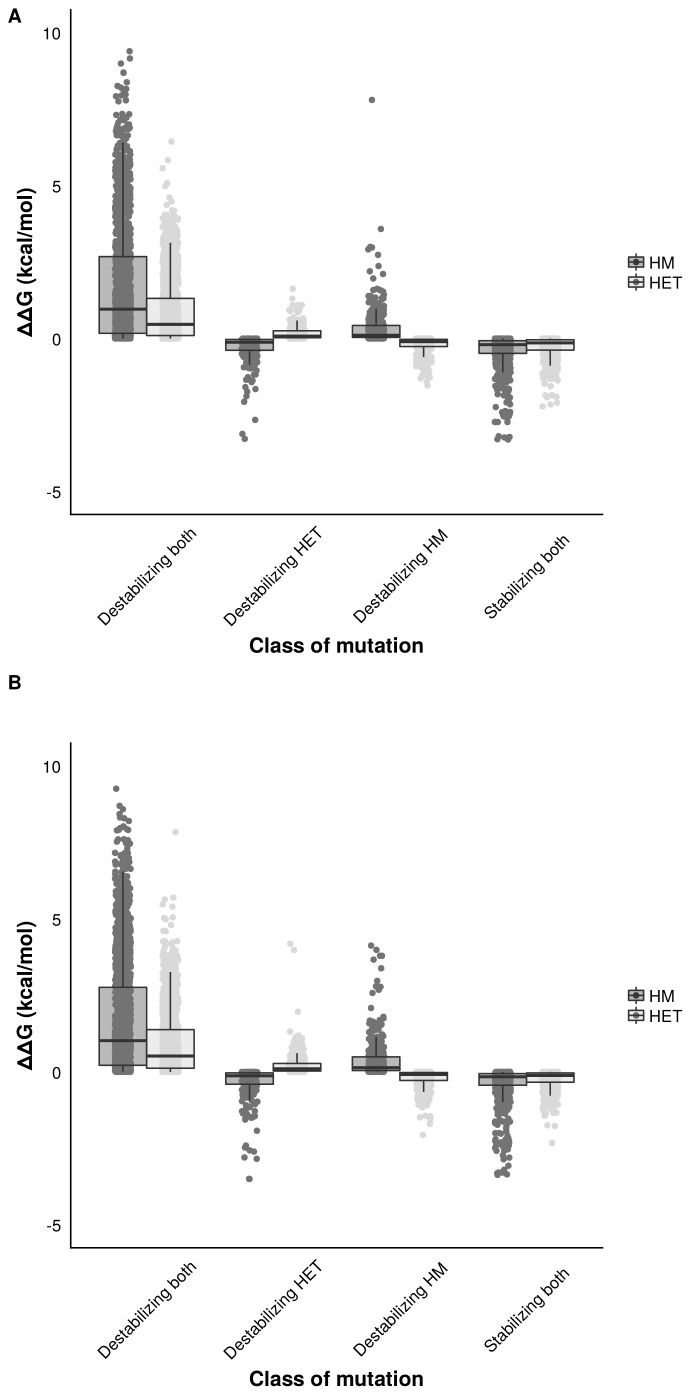
Figure 5—figure supplement 1. Distribution of effect sizes of mutations on the binding energy (ΔΔG) of HMs and HETs as estimated using FoldX.

Figure 5—figure supplement 1.

Effects of single mutants on the binding energy of HMs and HETs. Mutants were classified (x-axis) according to their effects on the binding energy of HMs and HETs, depending on whether they stabilize or destabilize both the HM and the HET or they only destabilized one of them. Mutations that destabilize one of the complexes have smaller effect sizes on binding energy than mutations that destabilize or stabilize both. (A) Mutations sampled when negatively selecting for the stability of both HMs. (B) Mutations sampled when negatively selecting for the stability of the HET. Parameters used for β and N were 10 and 1000, respectively.
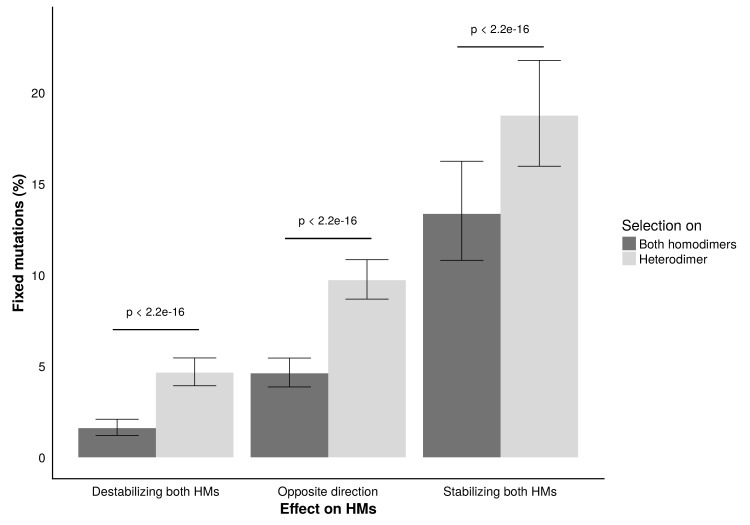
Figure 5—figure supplement 2. Fixation rates of double mutants during the simulations.

Figure 5—figure supplement 2.

Fixation rates of double mutants classified based on their effect on the two HMs and the complexes (both HMs or HET) under selection. Clopper-Pearson 95% confidence intervals are shown. P-values were calculated with a two proportion z-test. Parameters used for β and N were 10 and 1000, respectively.
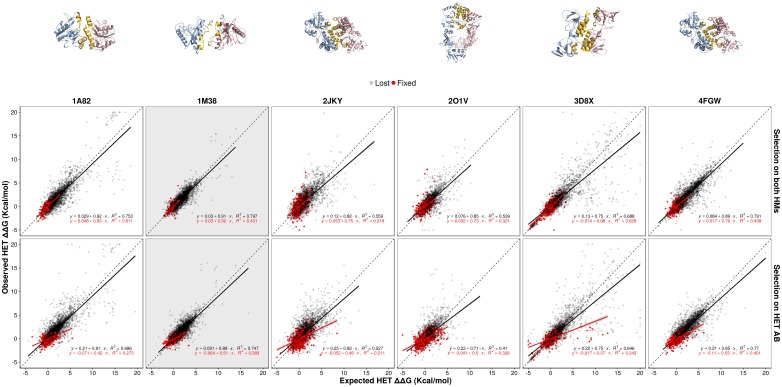
Figure 5—figure supplement 3. Contribution of epistasis to the evolution of HET for six different PDB structures.

Figure 5—figure supplement 3.

The observed effects of double mutants on the HET are compared with their expected effects based on the effects on the HMs throughout the simulations. Simulations were run under the same scenarios shown in Figure 5. Panels shown in Figure 5 are highlighted with a gray background. Red points are for mutations that were fixed, gray ones those that were eliminated by selection. The regression equations are shown for fixed and lost mutations separately. Parameters used for β and N were 10 and 1000, respectively.