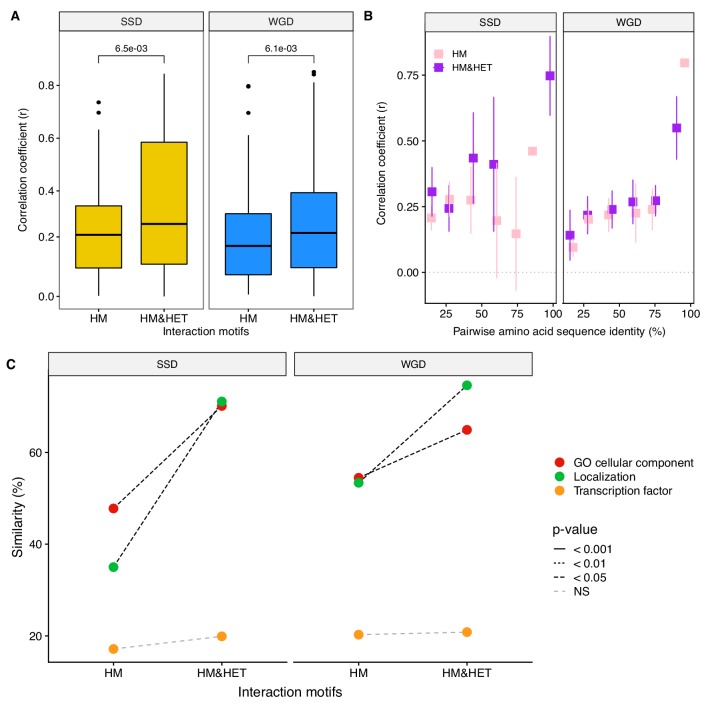
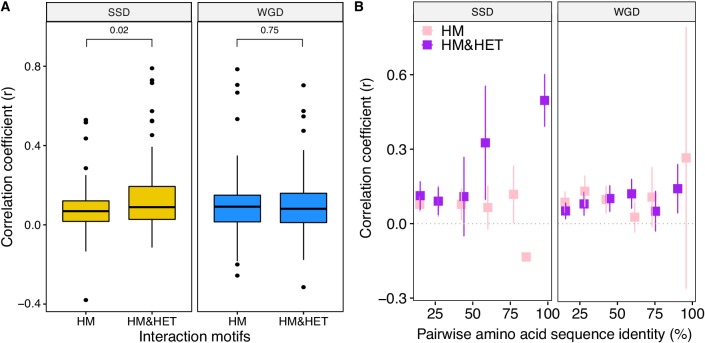
Figure 6. Loss of heteromerization between paralogs may result from regulatory divergence.
(A) Correlation coefficients (Spearman’s r) between the expression profiles of paralogs. The data derives from mRNA relative expression across 1000 growth conditions (Ihmels et al., 2004). HM and HM&HET are compared for SSDs (yellow) and WGDs (blue). P-values are from t-tests. (B) Correlation of expression profiles between paralogs forming only HM (pink) or HM&HET (purple) as a function of their amino acid sequence identity. The data was binned into six equal categories for representation only. (C) Similarity of GO cellular component, GFP-based localization, and transcription factor binding sites (100% * Jaccard’s index) are compared between HM and HM and HET for SSDs and WGDs. P-values are from Wilcoxon tests.


