Figure 2.
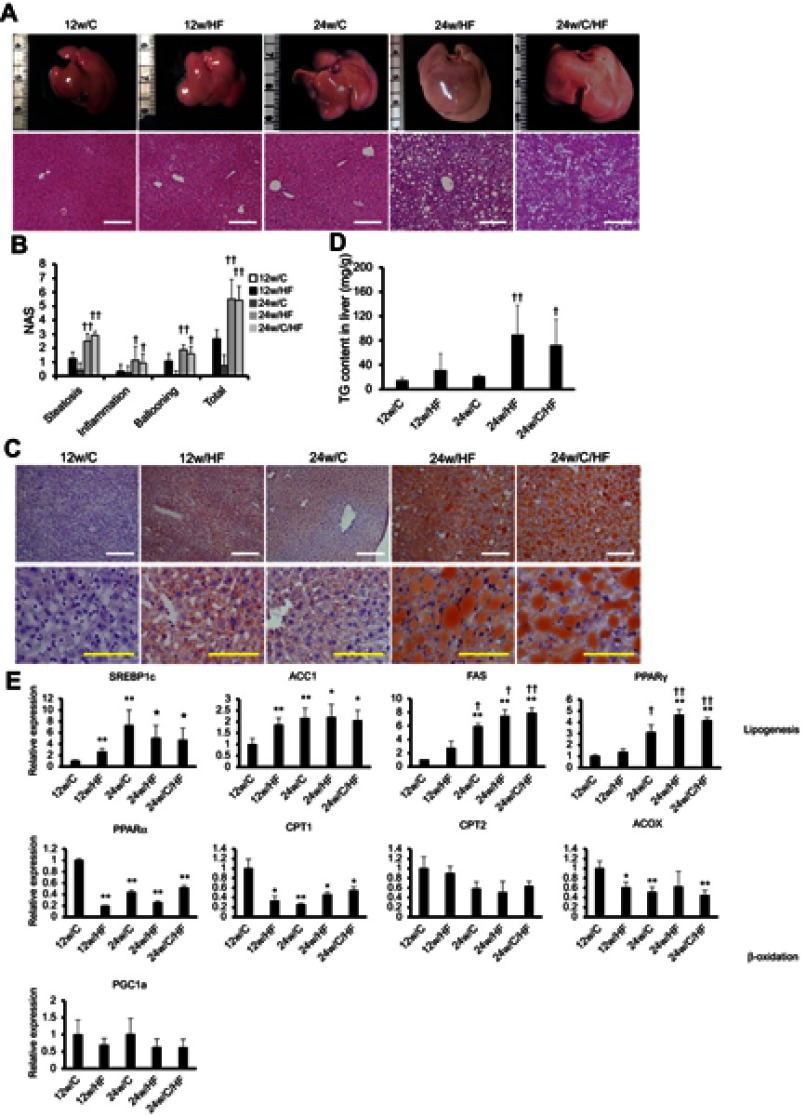
HF feeding promotes the features of steatohepatitis with age. (A) Macroscopic image and H&E staining of livers. The white scale bar represents 200 µm. (B) Measurement of NAFLD activity score (NAS), including hepatic steatosis (0: <5%, 1: 5–33%, 2: 33–66%, 3: >66%), inflammation (0: none, 1: <2, 2: 2–4, 3: >4 foci at 200×) and hepatocyte ballooning (0: none, 1: few, 2: many or prominent). (C) Oil-Red O staining of livers. White and yellow scale bars in each picture represent 200 µm and 100 µm, respectively. (D) TG content of liver tissues. (E) mRNA expression of lipogenic genes (SREBP1c, ACC1, FAS, PPARγ) and β-oxidation-associated genes (PPARα, CPT1, CPT2, PGC-1α). Values are mean ± SD. *p<0.05 or **p<0.001, vs 12w/C. †p<0.05 or ††p<0.001, vs 12w/HF. There are no significant differences between 24w/HF and 24w/C/HF groups.

