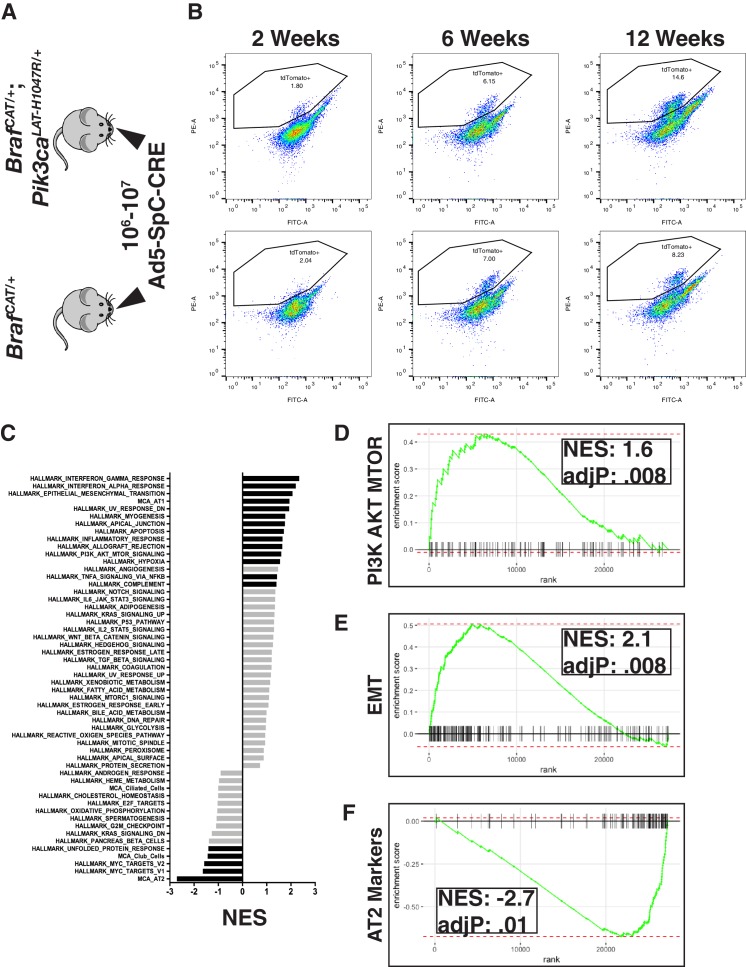
Figure 2. Examining global gene expression changes caused by combination of PI3K and MAPK activation using RNA-SEQ.
(A) Tumors were adenovirally induced in cohorts of BrafCAT/+ and BrafCAT/+;Pik3caLAT-H1047R/+ mice with AT2 specific CRE expression. Mice harvested at 2 or 6 weeks were induced with 107 PFU of Ad5-SpC-CRE, whereas mice harvested at 12 weeks were induced with 106 PFU of Ad5-SpC-CRE. (B) Tumor cells were harvested from each genotype at 2 weeks, 6 weeks, and 12 weeks post tumor induction via tissue dissociation and FACS. (C) GSEA analyses profiling cells sorted from BRAFV600E/PI3KαH1047R driven tumor bearing mice compared to BRAFV600E driven tumor bearing mice, showing all ‘Hallmark’ gene sets along with gene sets constructed from the most specific markers of the cell types of the distal lung epithelium. Black bars indicate adjP <.05, gray bars indicate Benjamini-Hochberg corrected enrichment statistic adjP ≥. 05. Here all time points combined within genotype. (D) GSEA mountain plot showing broad activation of PI3K signaling in BRAFV600E/PI3KαH1047R driven tumor bearing mice; adjP is Benjamini-Hochberg corrected enrichment statistic. (E) GSEA mountain plot showing broad activation of EMT in BRAFV600E/PI3KαH1047R driven tumor bearing mice; adjP is Benjamini-Hochberg corrected enrichment statistic. (F) GSEA mountain plot showing widespread loss of AT2 identity in BRAFV600E/PI3KαH1047R driven tumor bearing mice; adjP is Benjamini-Hochberg corrected enrichment statistic.


