. 2019 Aug 27;8:e43668. doi: 10.7554/eLife.43668

Figure 4. Expression levels and localization of lung lineage survival transcription factors are maintained in BRAFV600E/PI3KαH1047R driven tumors, Including those cells which have lost expression of markers of AT2 identity.

(A) BRAFV600E driven hyperplasia and tumors display widespread expression of both SFTPA and nuclear localization of the lung lineage transcription factor, NKX2-1, at 2 and 12 weeks post initiation. Scale bar = 10 um. (B) BRAFV600E/PI3KαH1047R driven hyperplasia and tumors show decreased SFTPA expression at 2 and 12 weeks post initiation. These tumors maintain broad nuclear expression of NKX2-1, including those cells with decreased SFTPA expression (yellow arrowheads). (C) Quantitation showing no significant difference in NKX2-1 immunoreactivity at 2 weeks post initiation, but a slight increase in nuclear NKX2-1 at 12 weeks post initiation. Wilcoxon rank sum p values = 0.2,. 02 respectively. (D) Significant reduction of SFTPA immunoreactivity seen in BRAFV600E/PI3KαH1047R driven hyperplasia and tumors at both 2 and 12 weeks post initiation. Wilcoxon rank sum p values = 5e-5, 4e-5 respectively. (E) Cytoplasmic SFTPA immunoreactivity plotted versus nuclear NKX2-1 immunoreactivity in BRAFV600E driven hyperplasia and tumors at 2 and 12 weeks post initiation. Similar association seen at both time points (Rho = 0.23,. 27 respectively). (F) Cytoplasmic SFTPA immunoreactivity plotted versus nuclear NKX2-1 immunoreactivity in BRAFV600E/PI3KαH1047R driven hyperplasia and tumors at 2 and 12 weeks post initiation. Relatively lower association seen at 2 weeks compared to 12 weeks (Rho = 0.07,. 40 respectively). (G) Overlay of BRAFV600E/PI3KαH1047R and BRAFV600E driven hyperplasia 2 weeks post initiation. Dashed line for each marker drawn at mean - one standard deviation of BRAFV600E driven tumors. BRAFV600E/PI3KαH1047R driven tumors show fewer SFTPA+, NKX2−1 + cells, most strongly accounted for by an increase in SFTPA-, NKX2−1 + cells. Chi square test associates genotype with distribution, p val <1e-5. (H) Overlay of BRAFV600E/PI3KαH1047R and BRAFV600E driven tumors 12 weeks post initiation. Dashed line for each marker drawn at mean - one standard deviation of BRAFV600E driven tumors. BRAFV600E/PI3KαH1047R driven tumors show fewer SFTPA+, NKX2−1 + cells, most strongly accounted for by an increase in SFTPA-, NKX2−1 + cells. Chi square test associates genotype with distribution, p val <1e-5.
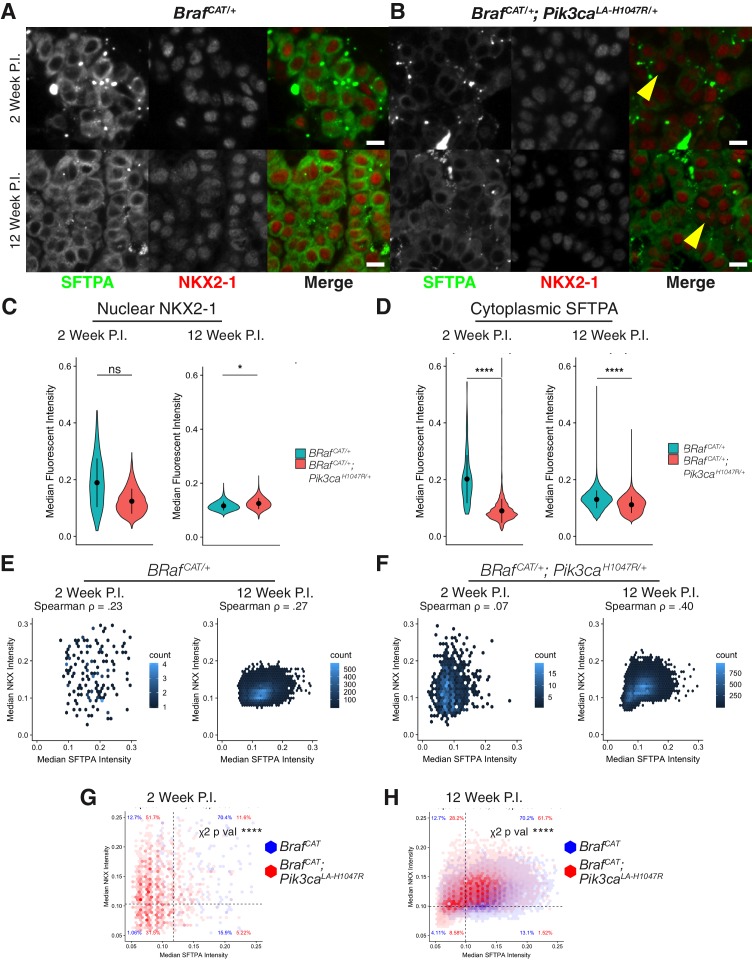
Figure 4—source code 1. R script to perform statistics on Figure 4—source data 12, as well as plot these results.
DOI: 10.7554/eLife.43668.020
Figure 4—source code 2. Cellprofiler pipeline to quantify raw images from BRAFV600E/PI3KαH1047R and BRAFV600E driven tumors, producing Figure 4—source data 1.
elife-43668-fig4-code2.cpproj (180.1KB, cpproj)
DOI: 10.7554/eLife.43668.021
Figure 4—source code 3. Cellprofiler pipeline to quantify raw images from KRASG12D/PIK3CAH1047R and KRASG12D driven tumors, producing Figure 4—source data 2.
elife-43668-fig4-code3.cpproj (119.9KB, cpproj)
DOI: 10.7554/eLife.43668.022
Figure 4—source data 1. Cellprofiler output quantifying immunofluorescence of SFTPA and NKX2-1 in BRAFV600E/PI3KαH1047R and BRAFV600E driven tumors.
DOI: 10.7554/eLife.43668.023
Figure 4—source data 2. Cellprofiler output quantifying immunofluorescence of SFTPA and NKX2-1 in KRASG12D/PIK3CAH1047R and KRASG12D driven tumors.
DOI: 10.7554/eLife.43668.024

Figure 4.

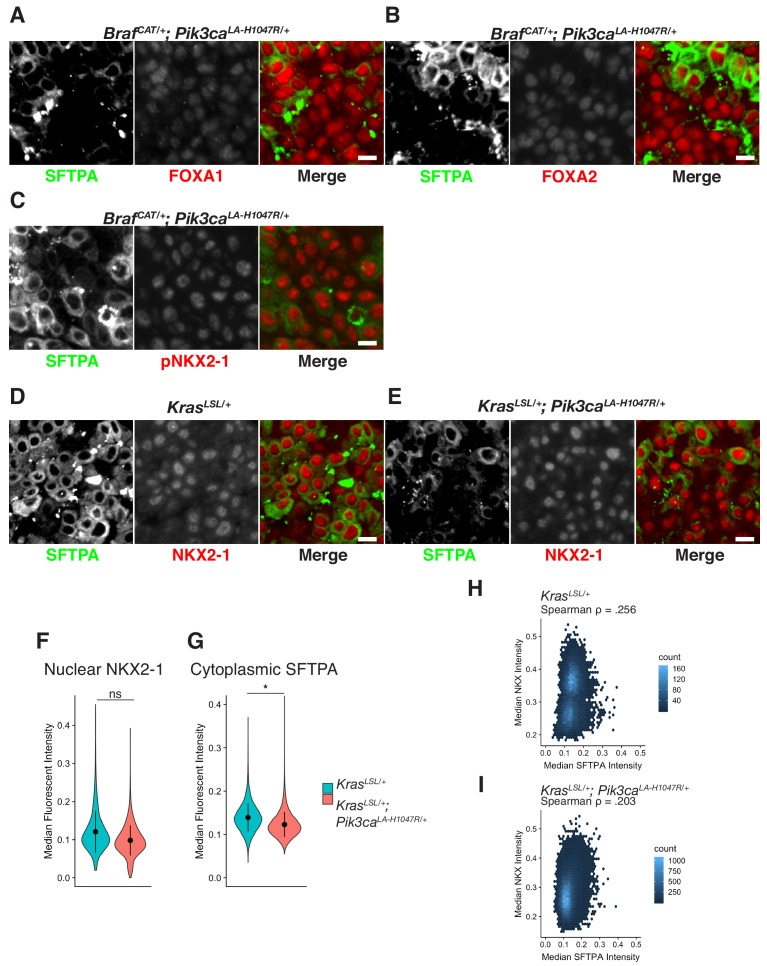
Figure 4—figure supplement 1. Expression levels and localization of lung lineage survival transcription factors are maintained in BRAFV600E/PI3KαH1047R and KRASG12D/PI3KαH1047R Driven Tumors, including those cells which have lost expression of markers of AT2 identity.

Figure 4—figure supplement 1.

(A) Tumor cells with decreased SFTPA maintain expression and nuclear localization of the lung lineage transcription factor, FOXA1. Scale bars = 10 um. (B) Tumor cells with decreased SFTPA maintain expression and nuclear localization of the lung lineage transcription factor, FOXA2. (C) Tumor cells with decreased SFTPA maintain phosphorylation of the lung lineage transcription factor, NKX2-1. (D) Expression of SFTPA and NKX2.1 are maintained in KRASG12D driven tumors, 16 weeks post initiation. (E) Activation of PI3K in KRASG12D driven tumors causes a decrease of SFTPA immunoreactivity not apparently associated with a decrease in NKX2-1 immunostaining. (F) No significant difference in NKX2-1 immunoreactivity upon PI3K activation in KRASG12D driven tumors. (G) Significant reduction in cytoplasmic staining of SFTPA upon PI3K activation in KRASG12D driven tumors. Wilcoxon rank sum p=0.0354. (H) Modest association between immunoreactivity of SFTPA and NKX2-1 in KRASG12D driven tumors (Spearman Rho = 0.256). (I) Modest association between immunoreactivity of SFTPA and NKX2-1 in in KRASG12D/PI3KαH1047R driven tumors (Spearman Rho = 0.203).