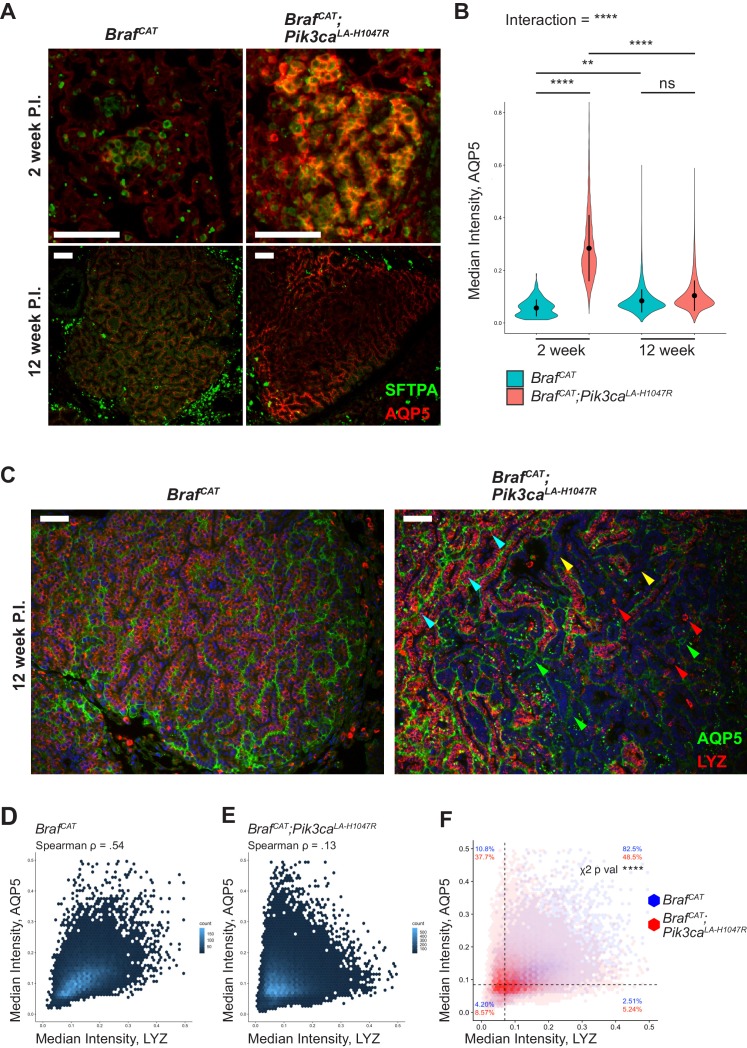
Figure 5. BRAFV600E/PI3KαH1047R and BRAFV600E driven tumors both show effects on differentiation status, with BRAFV600E/PI3KαH1047R driven tumors displaying more profound effects on identity.
(A) BRAFV600E/PI3KαH1047R and BRAFV600E driven hyperplasia both show immunoreactivity of the AT1 marker, AQP5, 2 weeks post initiation with BRAFV600E/PI3KαH1047R driven hyperplasia showing enhanced immunostaining. BRAFV600E/PI3KαH1047R and BRAFV600E driven tumors also show immunoreactivity of AQP5 12 weeks post initiation with BRAFV600E/PI3KαH1047R driven tumors showing a more variable pattern of immunostaining. Scale bars = 100 um. (B) Quantitation demonstrating significant effect of PI3KαH1047R on AQP5 immunoreactivity in BRAFV600E driven tumors 2 weeks post initiation. No difference seen in AQP5 immunoreactivity between BRAFV600E/PI3KαH1047R and BRAFV600E driven tumors 12 weeks post initiation. This appears to be the result of a slight increase in AQP5 immunoreactivity between 2 and 12 weeks in BRAFV600E driven tumors and a more dramatic decrease in AQP5 immunoreactivity between 2 and 12 weeks in BRAFV600E/PI3KαH1047R driven tumors. ANOVA p<1e-5, multiple comparisons done by Tukey’s Honest Significant Difference test, ****: p<1 e −5, **p=0.0014. (C) BRAFV600E driven tumors display widespread immunoreactivity to both AQP5 and the AT2 marker, LYZ, 12 weeks post initiation. BRAFV600E/PI3KαH1047R driven tumors show cells with widely varied expression of differentiation markers, including AQP5+, LYZ+ (Cyan arrows); AQP5-, LYZ+ (Red arrows); AQP5+, LYZ- (Green arrows); and AQP5-, LYZ- (Yellow arrows) cells. Scale bars = 100 um. (D) BRAFV600E driven tumors show relatively high association between AQP5 and LYZ immunoreactivity (Rho = 0.54). (E) BRAFV600E/PI3KαH1047R driven tumors show relatively low association between AQP5 and LYZ immunoreactivity (Rho = 0.13) (F) Overlay of BRAFV600E/PI3KαH1047R and BRAFV600E driven tumors 12 weeks post initiation. Dashed line for each marker drawn at mean - one standard deviation of BRAFV600E driven tumors. BRAFV600E/PI3KαH1047R driven tumors show fewer AQP5+, LYZ + cells, most strongly accounted for by an increase in AQP5+, LYZ- cells, but with increases also seen in AQP5-, LYZ + and AQP5-, LYZ- cells. Chi square test associates genotype with distribution, p val <1e-5.


