Figure 6. Loss of PGC1α Expression Correlates With Change in Expression of Lung Markers.
(A) Hypothetical model showing an additional factor cooperating with lung lineage transcription factors that is downregulated upon dual arm mutational activation of growth factor signaling. (B) Weighted gene correlation network analysis (WGCNA) heat map identifies 21 correlated gene expression modules. Gene tree shows relationship of individual genes, where multi-color bars adjacent to heat map identify individual clusters. (C) Table summarizing result of WGCNA analysis and AT1/AT2 memberships. Cluster number is listed adjacent to color corresponding to cluster in (B). For each cluster, shown is the total number of genes along with the number of AT1 and AT2 marker genes from AT1-100 and AT2-100. Cluster two contains the majority of both AT1 and AT2 marker genes. (D) A three factor approach to identify novel regulators of pneumocyte identity. Within the intersection of differentially expressed genes, genes co-regulated with the majority of AT1 and AT2 specific genes, and known transcription factors, lies a single gene, PGC1α. (E) PGC1α is significantly downregulated in BRAFV600E/PI3Kα H1047R driven tumors compared to BRAFV600E driven tumors; adjP is Benjamini-Hochberg corrected P value from DESeq2. (F) Decreased nuclear PGC1α immunoreactivity (red arrows) correlates with loss of AT2 identity on a cell by cell basis. AT2 identity is maintained in those cells which maintain nuclear PGC1α immunoreactivity (green arrows).

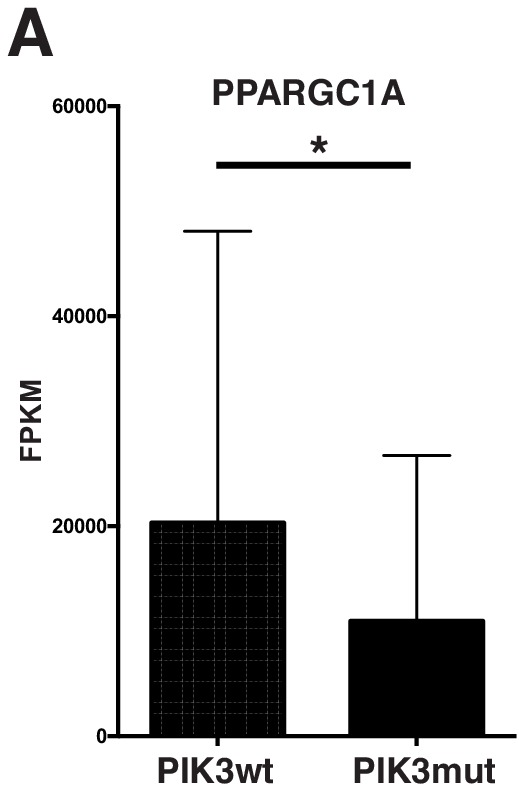
Figure 6—figure supplement 1. Mutations predicted to affect the PI3' lipid signaling pathway correlate with decreased PPARGC1A in human lung adenocarcinoma.