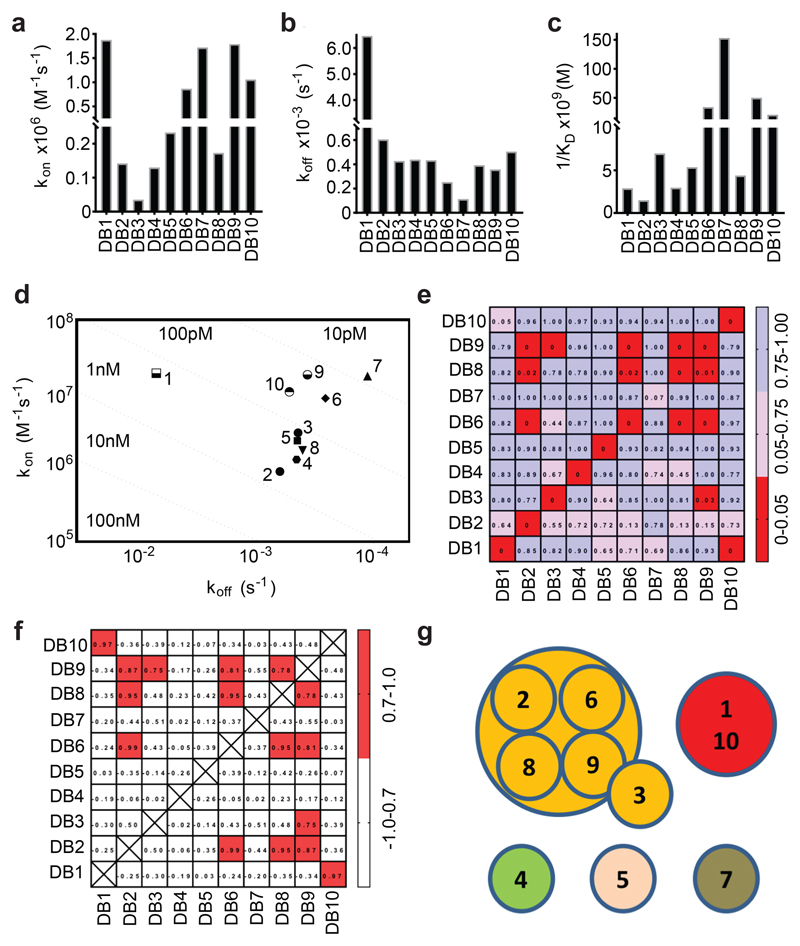
Figure 1. Binding kinetics and epitope bins for the human anti-PvDBPII mAb panel.
Kinetic rate constants of binding for ten human mAbs (DB1-DB10) to PvDBPII as determined by SPR. (A) Association rate constant (kon); (B) Dissociation rate constant (koff); (C) Association constant (1/KD); and (D) Iso-affinity plot of kon against koff. (E) A “relative binding” matrix showing the fraction of a mAb bound to PvDBPII in the presence of a second bound mAb. Assays were conducted in both orientations. Boxes are colour-coded with ≥ 0.75 in blue, 0.75 > X > 0.05 in pink and ≤ 0.05 in red. Negative values were normalised to 0 and values >1 were normalised to 1. (F) A “binding profile correlation” matrix showing the Pearson product-moment correlation values of each mAb pair. The correlation threshold was set at 0.7; values equal to or above this are coloured in red as the threshold chosen to represent competition. (G) Epitope bins determined from E and F.

