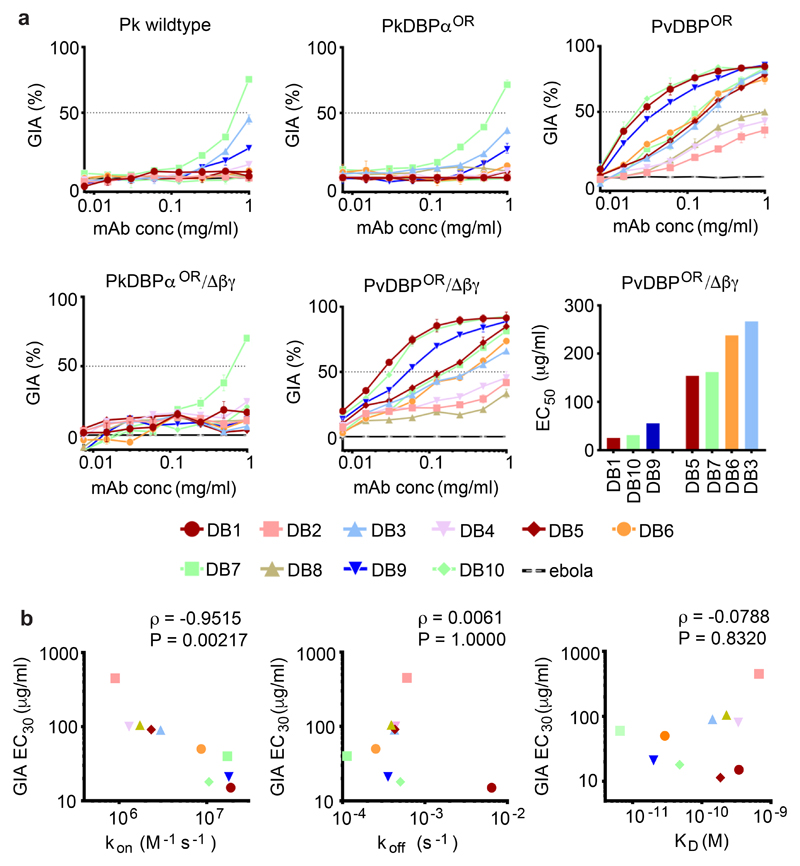
Figure 3. Growth inhibition of transgenic Plasmodium knowlesi (Pk) lines expressing PvDBP.
(A) Assays of growth Inhibitory activity (GIA) by the ten anti-PvDBPII human mAbs against five different Pk lines: ‘Wild type’ Pk (A1-H.1); PkDBPαOR; PkDBPαOR/Δβγ; PvDBPOR and PvDBPOR/Δβγ. Inhibition was tested in a two-fold dilution series starting at 1 mg/mL. Data points represent the mean of three technical replicates, while the error bars represent the standard deviation. The EC50 values (interpolated by non-linear regression) are shown in ascending rank order for the seven mAbs which reached >50 % GIA against PvDBPOR/Δβγ at the maximum concentration (1 mg/mL). (B) kon (on-rate), koff (off-rate) and KD (dissociation constant), plotted against GIA EC30 for PvDBPOR/Δβγ. EC30 values were used to include weaker-neutralising mAbs and were interpolated from non-linear regression curves. Kinetic data are as Figure 1 and Supplementary Table 2. Spearman’s rank correlation coefficient (ρ) and P value are shown.

