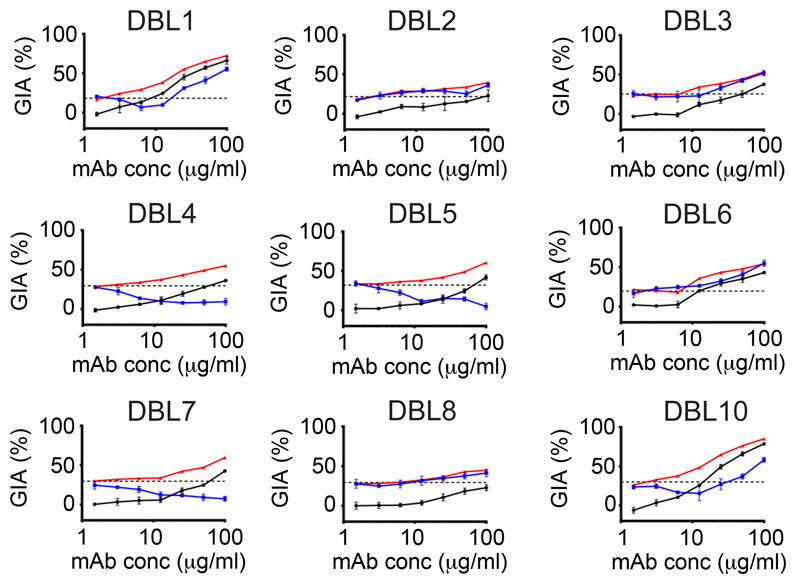
Figure 5. Assessment of synergy, additivity and antagonism by anti-PvDBPII human mAb combinations.
Assays of growth inhibitory activity (GIA) were performed to assess the inhibitory activity of DB9 in combination with the other mAbs against the PvDBPOR transgenic Plasmodium knowlesi line. DB9 was held at a fixed concentration of 25 μg/mL, while the other mAbs are in a two-fold dilution series starting at 100 μg/mL. The black line shows the % inhibition of each mAb in the absence of DB9. The red line shows the predicted additive inhibition (‘Bliss additivity’ as calculated in the equation in Methods) of the indicated mAb plus DB9 at 25 μg/mL. The blue line shows the actual observed % inhibition of the two combined mAbs. The dotted black line gives the % inhibition of DB9 alone at 25 μg/mL. Data points represent the mean of three technical replicates, while the error bars represent the standard deviation.

