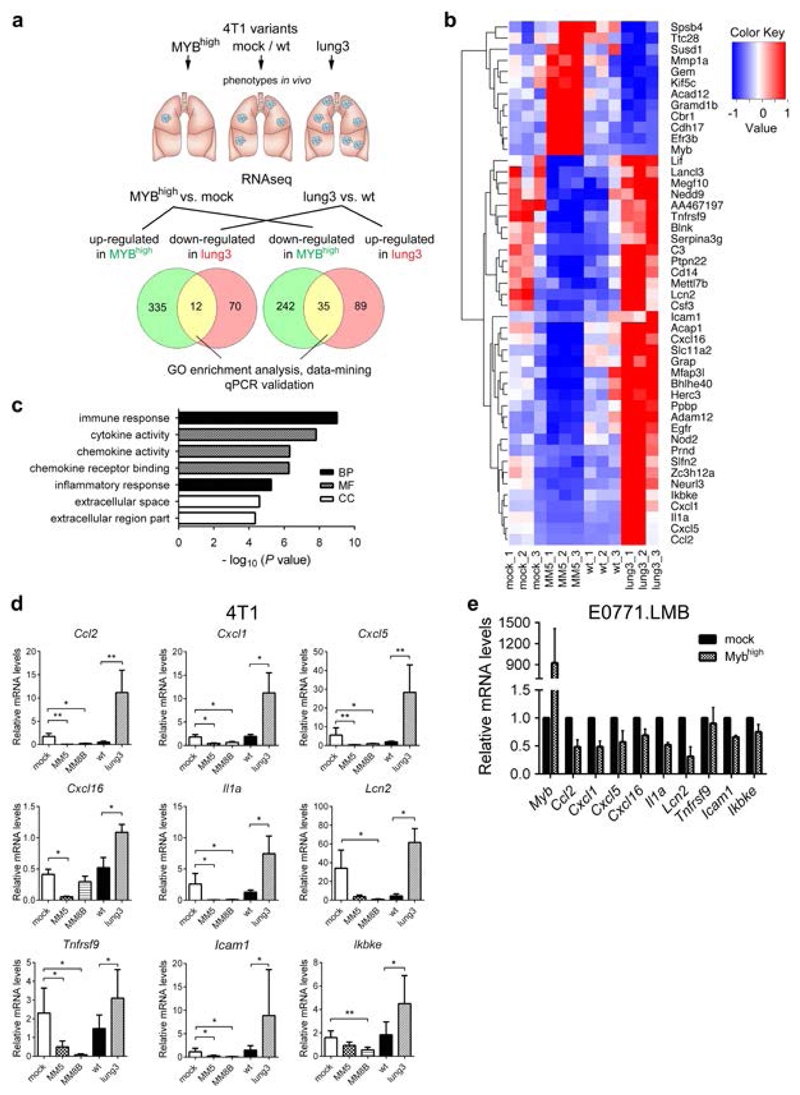
Figure 2. c-Myb represses immune/inflammatory response genes in BC cells.
(a) Strategy of RNAseq analysis to identify overlapping genes up/down-regulated in 4T1 MYBhigh and lung3 cells. (b) Heat map of 47 genes identified as induced/repressed in 4T1 MYBhigh and lung3 cells (fold change>1.5, p<0.01). (c) DAVID analysis software was used to find the Gene Ontology (GO) terms that were significantly enriched (FDR<0.05) in a 35 gene set highly expressed in lung3 and suppressed in MYBhigh cells (BP, biological process; MF, molecular function; CC, cellular compartment). (d) Expression levels of selected mRNAs in 4T1 MYBhigh clones and the lung3 subline were analyzed by qPCR, normalized to Gapdh and displayed as relative values to parental cells (n=3). *; p<0.05; **; p<0.01. (e) Expression levels of selected mRNAs after transient (48 hours) Myb overexpression in E0771.LMB cells by qPCR, normalized to Gapdh and displayed as relative values to mock-transfected E0771.LMB cells (n=3).

