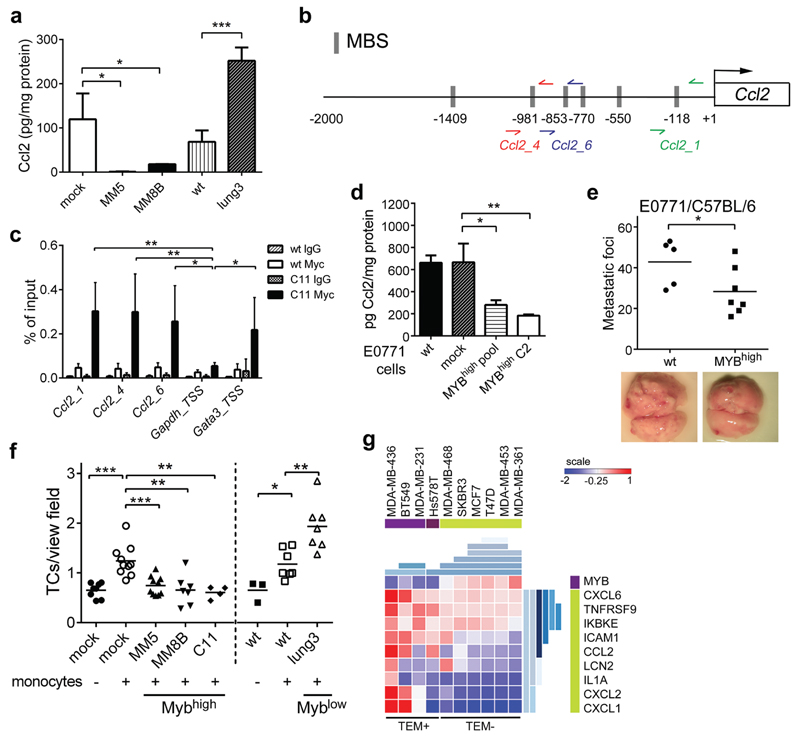
Figure 3. c-Myb suppresses Ccl2 expression and inhibits tumor cell metastasis and TEM.
(a) Ccl2 protein levels in the tumor cell conditioned media were normalized to total protein content (n=3). (b) Schematic representation of the promoter region of murine Ccl2 gene on chromosome 11. The potential c-Myb binding sites (MBSs, identified by TFSEARCH and ConSite, http://consite.genereg.net), the regions amplified after ChIP (primer pairs: red, blue, and green arrows) are depicted. (c) ChIP assays were performed with anti-Myc-Tag antibody or non-specific mouse IgG in 4T1 cells transfected with Myc-tagged-Myb (C11) and wt cells (n=3). Three primer sets spanning different MBSs were used for qPCR amplification and data are shown as percentage of input, unpaired t-test. Gapdh was used a negative control; Gata3 as a positive control. (d) Ccl2 protein levels in the E0771.LMB tumor cell conditioned media: wt, mock-transfected controls, MYBhigh pool and MYBhigh C2 normalized to total protein content (n=3, unpaired t-test). (e) Quantification of lung metastasis in mice i.v. injected with E0771.LMB cells 17 days p.i. (2 independent experiments) (f) Transmigrated 4T1 cells through primary lung ECs in the absence or presence of monocytes after 16 hours of co-culture. (3 independent experiments) (g) Expression-based clustering of BC cell lines (GSE44552) according to the TEM activity. Signature genes expression levels as determined by microarrays are visualized in a heat-map. Hierarchical clustering by Gitools is shown in shades of blue. *; p<0.05; **; p<0.01; ***; p<0.001.

