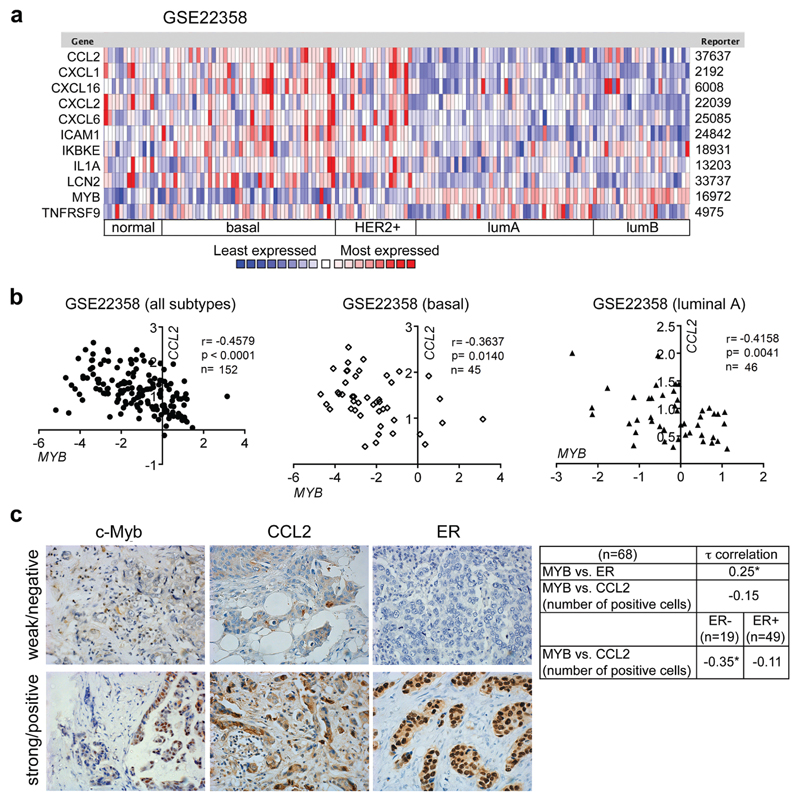
Figure 5. Inversed MYB-inflammatory signature expression in human BCs.
(a) Heat map showing expression levels of MYB and identified signature genes in human BCs (GSE22358). Red and blue indicate high and low mRNA expression levels, respectively. (b) Significant correlations between mRNA expression of MYB and CCL2 in the same dataset of BCs samples as in A and stratified according to the molecular subtype (basal, luminal A). (c) Representative IHC stainings of human BCs for c-Myb, Ccl2, ER (left). Kendall’s Tau correlation between ER, CCL2 and c-Myb detection analyzed in a group of 68 BC patients, and in ER+ and ER- patients. *; p<0.05.

