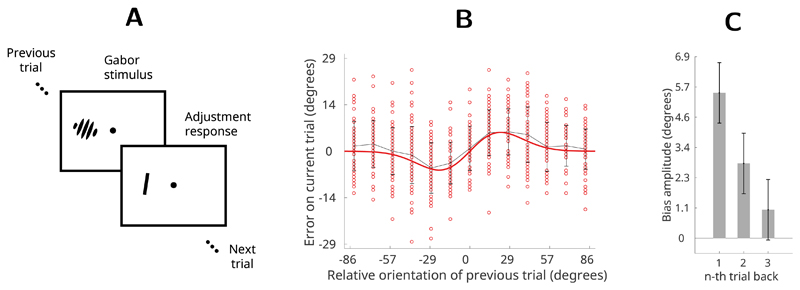
Figure 1. Orientation estimation task (Fischer & Whitney, 2014).
(A) Participants observed randomly oriented Gabor stimuli and reported the orientation of each Gabor by adjusting a response bar. Stimuli were presented for 500 ms and separated in time by 5s. (B) Single subject’s errors (red dots) as a function of the relative orientation of the previous trial. Gray line is average error; red line shows a first derivative of a Gaussian (DoG) curve fit to the data. (C) Average recency bias amplitude across participants computed for stimuli presented one, two and three trials back from the present. Error bars represent ±1 standard deviation of the bootstrapped distribution.

