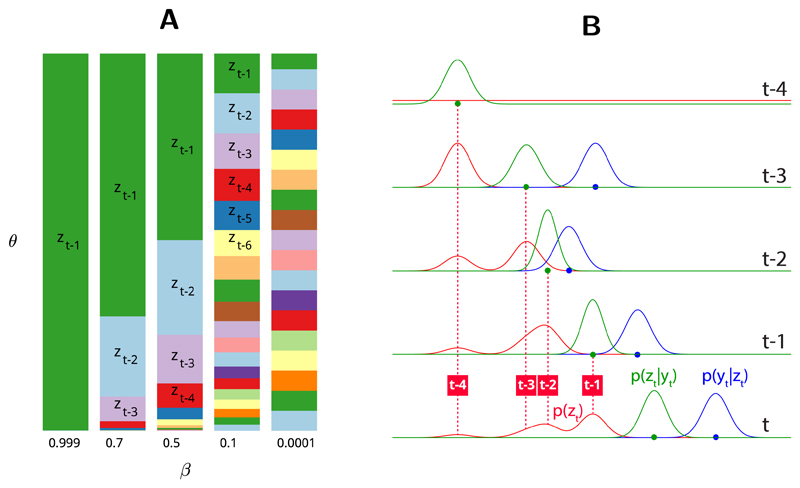
Figure 7. Mixture model.
(A) Values of the mixing coefficient θ over past states (zt−1, . . . , zt−m) based on different β values. θ represents the proportion of a past state zt in the mixture distribution (Eq 7). (B) Evolution of the latent state p(z) over 4 trials.

