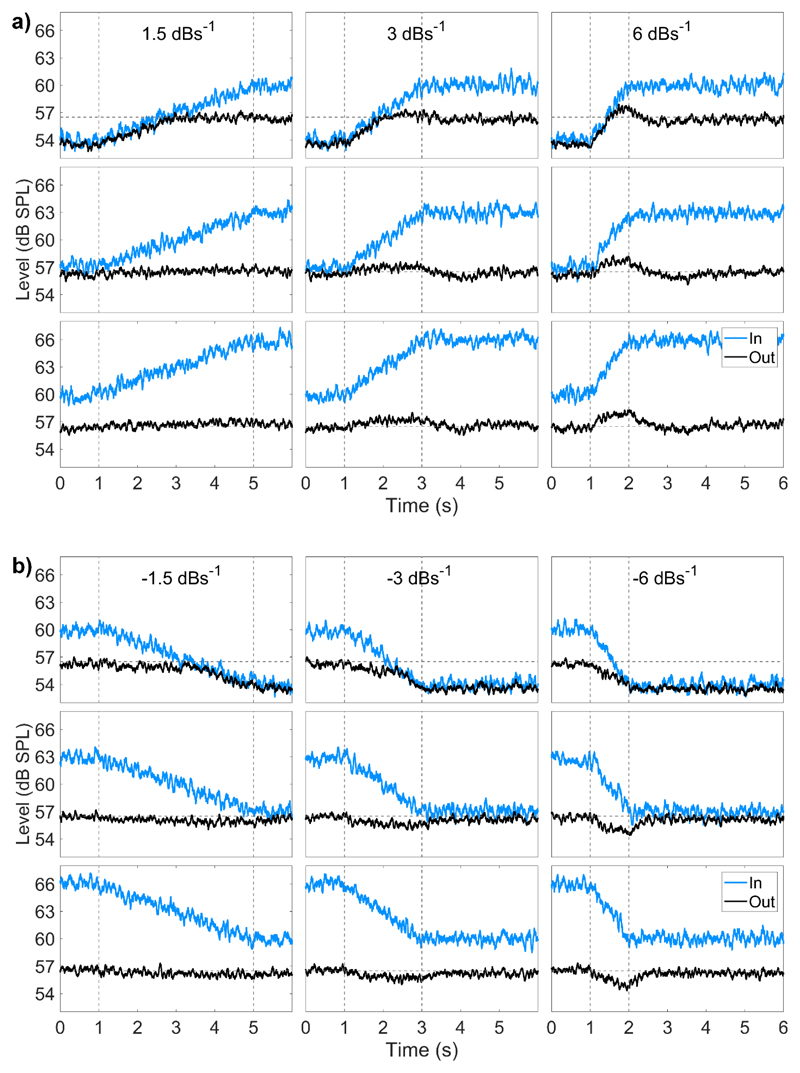
Figure 2.
a) Input and output level changes for +6dB input level increase. Each column displays a different increase rate. Column one (left) shows 1.5 dBs-1, column two (middle) 3 dBs-1, and column three (right) 6 dBs-1. Each row shows a different starting level. Row one shows a starting input level of 54 dB SPL, row 2 57 dB SPL, and row 3 60 dB SPL. Input is shown in grey and output in black. The areas of the plots bounded by the dashed lines show the period of rotational movement. b) The same as 2b, for an input level decrease of -6 dB. Row 1 shows a starting level of 60 dB SPL, row 2 63 dB SPL, and row 3 66 dB SPL.

