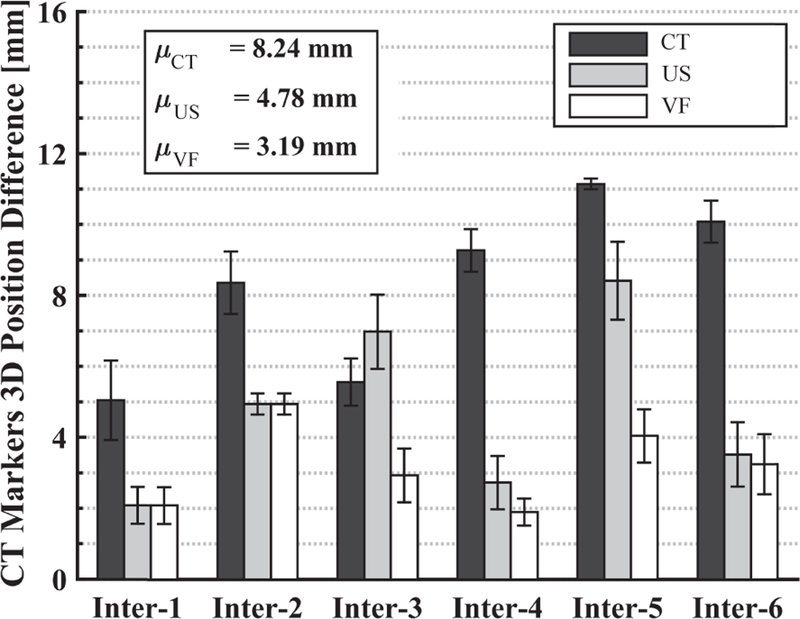
Fig. 13.
Marker position differences (in CBCT image coordinates) between SIM day and each interfraction day with: (Black) CT couch shift only, (Gray) 2nd couch shift based on US feedback at recorded probe position, (White) 2nd couch shift based on US after probe repositioned with virtual fixtures. Each bar shows the mean result of three markers.

