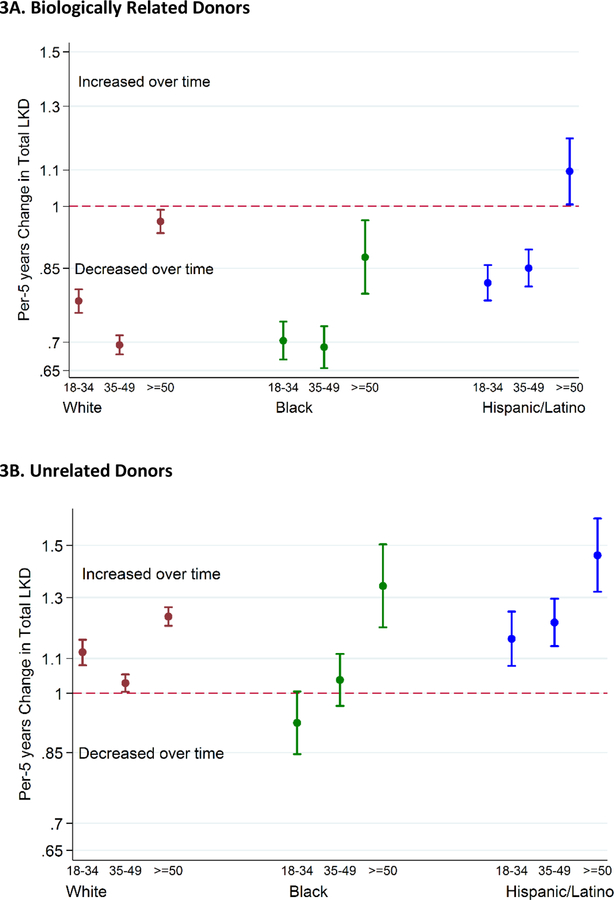
Figure 3.
Incident Rate Ratio of Live Kidney Donation from 2005 to 2017 by Age, Stratified by Relationship with the Recipient.
Per 5-years change in number of live kidney donors estimated from Poisson regression model. An incidence rate ratio less than one indicates a decline each year in the number of live kidney donors. The number of biologically related white and black donors of all ages and the number of biologically related Hispanic donors under the age of 50 declined after 2005. Conversely, the number of biologically unrelated white and Hispanic donors of all ages and the number of biologically unrelated black donors over the age of 50 increased after 2005.

