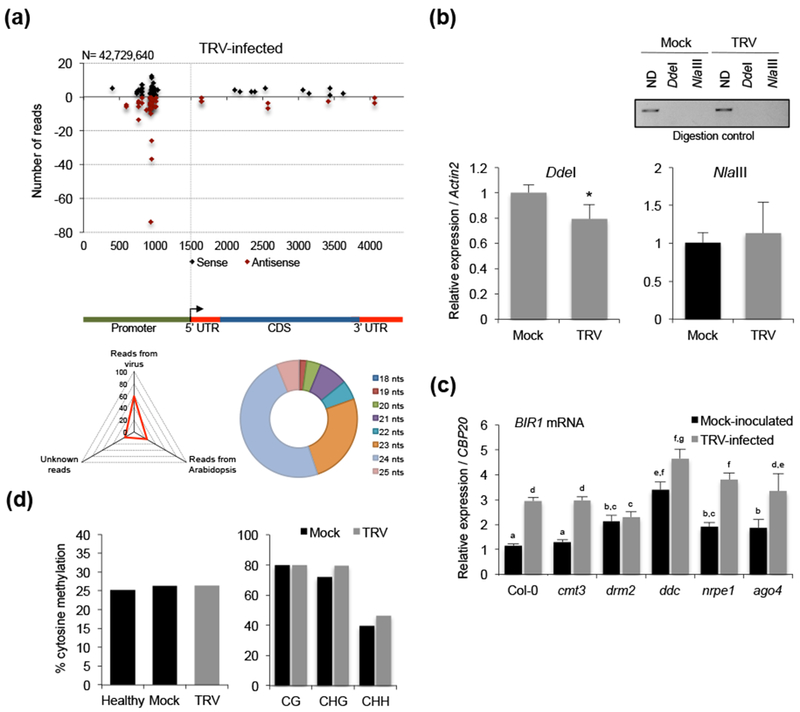
Figure 4.

BIR1 methylation status in TRV-infected Arabidopsis. (a) Distribution of BIR1-derived siRNAs in rosette leaves of TRV-infected Arabidopsis plants. Sense (black dots) and antisense (red dots) siRNA species are represented as positive and negative values on the y-axis, respectively. The triangle graph represents the genomic distribution (percentage) of sRNAs in the sequenced set. N denotes the total number of filtered sequenced reads. The circle graph represents the size distribution of BIR1-derived siRNAs in TRV-infected plants. (b) Extent of asymmetric cytosine methylation at the BIR1 promoter determined by chop-qPCR in rosette leaves of mock-inoculated and TRV-infected plants at 8 days post-inoculation (dpi). The genomic DNA was digested with methylation-sensitive enzymes DdeI and NlaIII and qPCR amplified. Non-digested (ND) plants were used as control. Values were normalized to the Actin2 internal control. Error bars represent SD from three independent biological replicates. (c) Accumulation of BIR1 transcripts in rosette leaves of mock-inoculated and TRV-infected plants of wild type (Col-0) and RdDM mutants (cmt3, drm2, ddc, nrpe1 and ago4) at 8 dpi. Relative values were determined by qRT-PCR and normalized to the CBP20 internal control. Error bars represent SD from three independent PCR measurements. (d) Percentage of total cytosine methylation (left) and CG, CHG and CHH methylation (right) determined by in-house bisulfite sequencing at the BIR1 promoter in healthy (non-inoculated), mock-inoculated and TRV-infected Arabidopsis at 8 dpi. H represents A, T or C. Asterisks (Student’s t test) or different letters (one-way ANOVA) were used to indicate significant differences (P < 0.001). The experiments were repeated at least three times with similar results and one representative biological replicate is shown.
