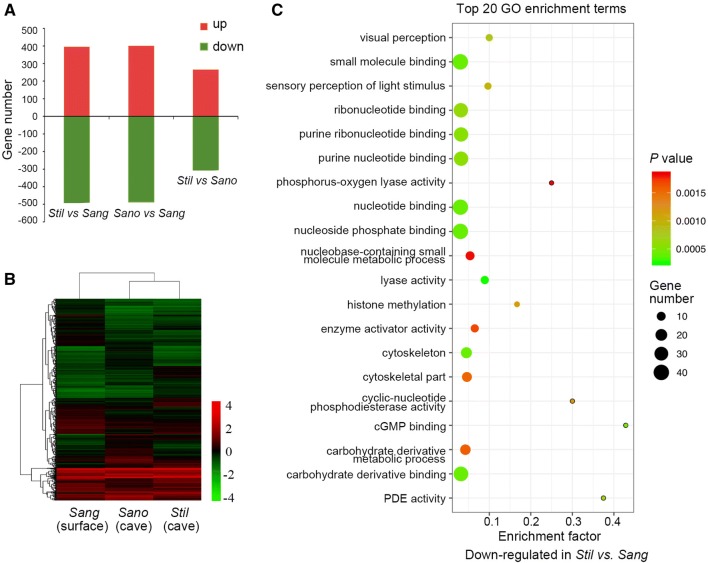
Fig. 2.
Identification and analysis of differentially expressed genes in Sinocyclocheilus species. a The number of up-regulated and down-regulated differentially expressed genes from comparisons among three species. b Hierarchical clustering and heat map of differentially expressed genes in the three species. Each column represents a species, and each row represents a gene. Green indicates the low level of gene expression, and red means high level. c Significant enrichment of down-regulated differentially expressed genes between S. tileihornes and S. angustiporus in the top 20 GO terms selected by the P values. The x-axis represents the enrichment factor; the y-axis represents the GO terms. Point size indicates the number of genes enriched in the GO term. Colour means the P value

