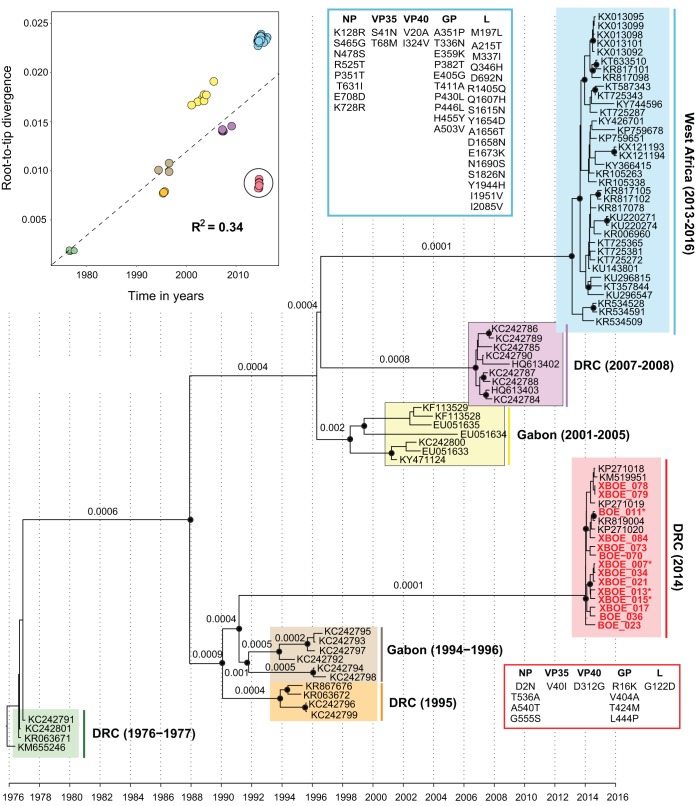
FIG 1.
Temporal signal and molecular clock phylogeny of the Zaire ebolavirus lineage. (Top left) Regression of sample collection dates against root-to-tip genetic distances obtained from an estimated maximum likelihood phylogeny. The phylogeny shown here was estimated using a Bayesian molecular clock approach from the complete coding genome sequences of 85 Zaire ebolaviruses, including 18 sequences collected from the 2014 outbreak in the Democratic Republic of the Congo. Black circles at phylogenetic nodes indicate Bayesian posterior probabilities of >0.75, and numbers below or above phylogenetic branches indicate branch-specific evolutionary rates estimated from the relaxed molecular clock model. Genome sequences generated in this study are in bold.

