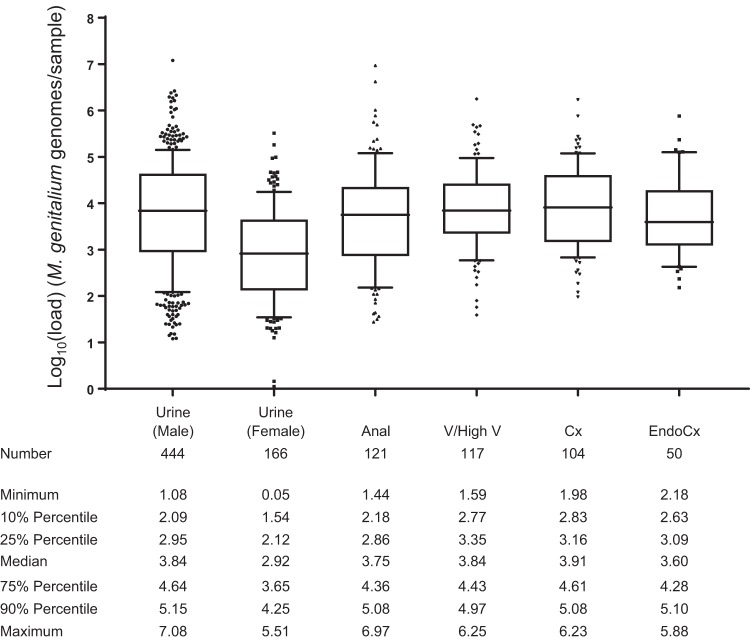
FIG 3.
Diagnostic specimen sample loads stratified by sample type. Sample loads estimated from the ResistancePlus MG assay (expressed as genome equivalents per swab or per 1 ml for urine) were log10 transformed and plotted. Analysis of the range and distribution of loads is presented in tabular form. Whiskers represent the 10th/90th percentiles, and outliers are indicated. Samples types not represented in the figure include urethral swabs (n = 7), rectal swab (n = 1), and urine samples where sex was indicated as “other” (n = 2). Only the median for female urine samples was significantly different to other sample types (P < 0.0001).

