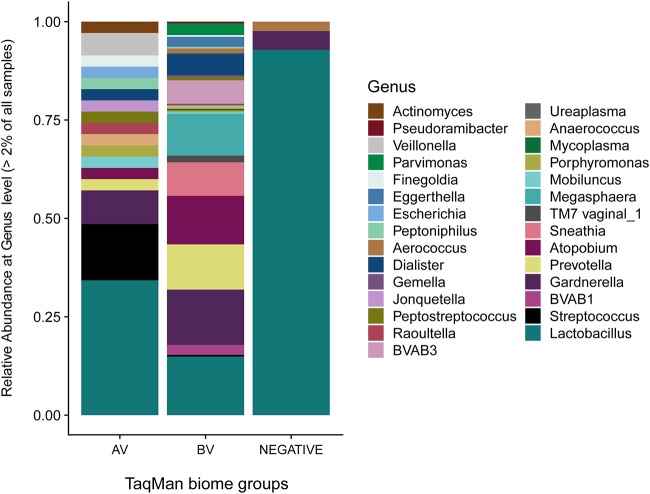
FIG 1.
Relative abundances of all genera present in the total data set >2% using the 16S rRNA gene V3 region amplicon data sequenced on the MiSeq platform (Illumina). Samples are grouped by biome as determined by the qPCR results and preliminary comparison of microbiome diversity (see Fig. S1 in the supplemental material).

