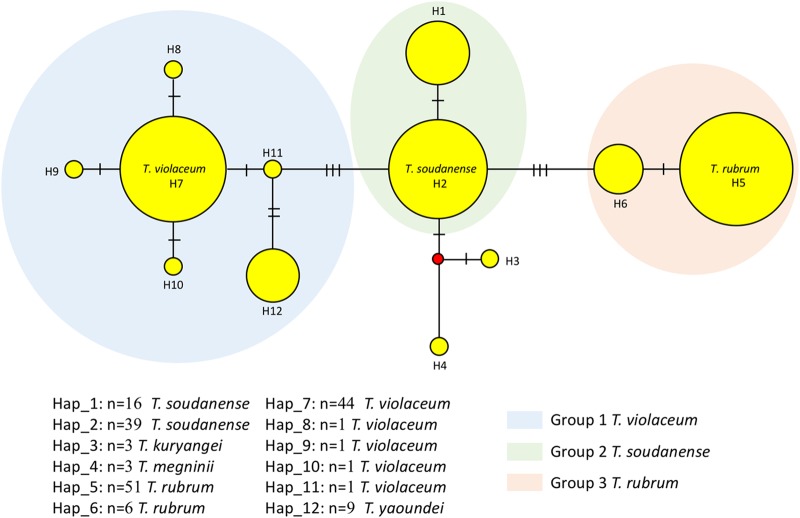
FIG 1.
Medium-joining haplotype network of the T. rubrum complex generated from the ITS sequences of 175 strains. Yellow circles represent haplotypes; the circle size indicates frequency. Haplotypes were grouped as identified by ITS data. Mutational steps are indicted by hashtags; red dots (median vectors) represent hypothetical haplotypes.

