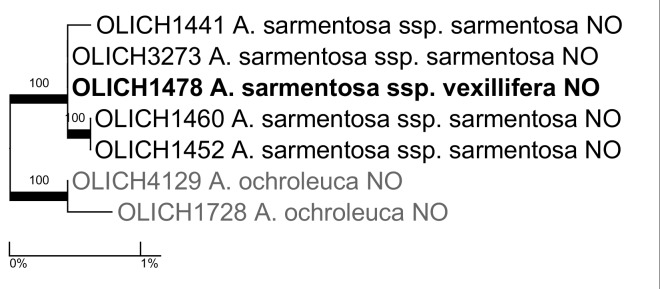
Figure 5.
Maximum likelihood tree based on the OLICH sequences of Alectoria sarmentosa.
Numbers above branches and thick lines indicate bootstrap support ≥ 70%. Bold font indicates focus taxon and grey font the outgroup. The two-letter ISO country codes are included. This applies for all phylogram figures (Figs 5, 6, 7, 8, 9, 10, 11, 12, 13, 14, 15).

