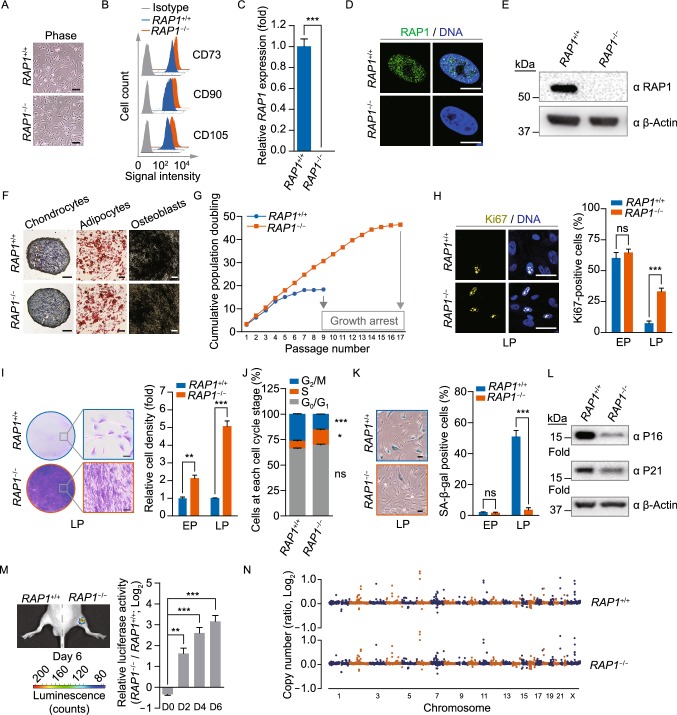
Figure 2.
RAP1−/− hMSCs exhibited retarded cellular senescence. (A) Brightfield micrographs of hMSCs showed normal morphology. Scale bar, 50 µm. (B) Flow cytometry demonstrated that sorted hMSCs uniformly expressed the MSC-specific surface markers CD73, CD90 and CD105. (C) qRT-PCR analysis demonstrated the deletion of RAP1 at the transcriptional level in RAP1−/− hMSCs by primers P8 and P9. Data were presented as the mean ± SEM, n = 3. ***P < 0.001. (D) Immunofluorescence micrographs of RAP1 in WT and RAP1−/− hMSCs. Scale bar, 10 µm. (E) Western blotting analysis demonstrated the absence of RAP1 in RAP1−/− hMSCs. β-Actin was used as a loading control. (F) Characterization of the differentiation potential of hMSCs. Toluidine blue O, Oil Red O and Von Kossa staining were used to detect chondrocytes, adipocytes and osteoblasts, respectively. Scale bar, 200 µm. (G) Cell growth curves showed the enhanced proliferation ability of RAP1−/− hMSCs. (H) Immunostaining of the proliferation marker Ki67 in WT and RAP1−/− hMSCs. EP (early passage) and LP (late passage) represented P2 and P9, respectively. Scale bar, 50 µm. Data were presented as the mean ± SEM, n = 6. NS, not significant, ***P < 0.001. (I) Clonal expansion analysis of WT and RAP1−/− hMSCs. EP and LP represented P2 and P9, respectively. Scale bar, 50 µm. Data were presented as the mean ± SEM, n = 3. **P < 0.01, ***P < 0.001. (J) Cell cycle analysis of WT and RAP1−/− hMSCs (LP). Data were presented as the mean ± SEM, n = 3. NS, not significant, *P < 0.05, ***P < 0.001. (K) SA-β-gal staining of WT and RAP1−/− hMSCs. EP and LP represented P2 and P9, respectively. Scale bar, 50 μm. Data were presented as the mean ± SEM, n = 6. NS, not significant, ***P < 0.001. (L) Western blotting analysis showed decreased expression of P16 and P21 in RAP1−/− hMSCs (LP). β-Actin was used as a loading control. (M) Photon flux from TA muscle implanted with WT (left) and RAP1−/− (right) hMSCs (LP) expressing luciferase. Data were presented as the mean ± SEM of RAP1−/− to WT ratios (Log2(fold change)), n = 5. **P < 0.01, ***P < 0.001. (N) Identification of CNVs by whole-genome sequencing analysis in WT and RAP1−/− hMSCs (EP) showed genomic integrity in RAP1−/− hMSCs

