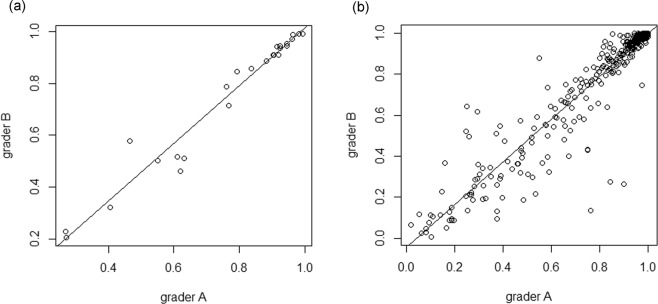
Figure 2.
Scatter plots of the integrity of EZ quantified by two graders. Comparison of the measurement of the rEZ index between 2 graders are shown. (a) rEZc, the ICC value was equal to 0.938 (95%CI: 0.916–0.945, p < 0.001). (b) rEZave, the ICC was 0.979 (95% CI: 0.936–0.987, p < 0.001). EZ: ellipsoid zone, rEZ: residual ellipsoid zone, rEZc: the rEZ index of the central horizontal line scan across the fovea, ICC: intraclass correlation coefficient, CI: confidence interval, rEZave: the average of rEZ indices of 13 line scans within 3 × 3-mm area.

