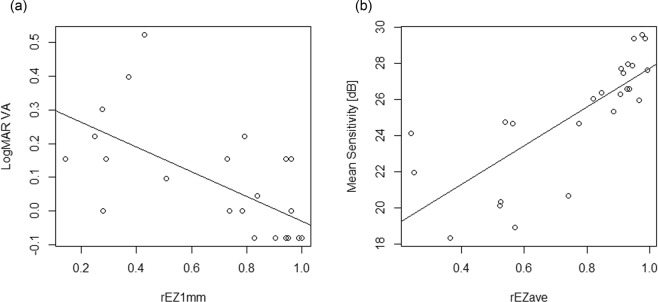
Figure 3.
Scatter plots showing the relationship between the integrity of EZ and visual function. (a) The relationship between rEZ1mm and LogMAR VA. (LogMAR VA = 0.337–0.366 x rEZ1mm, SE = 0.0891, p < 0.001, linear regression). (b) The relationship between rEZave and MS. (MS (dB) = 17.0 + 10.7 x rEZave, SE = 1.83, p < 0.001, linear regression). EZ: ellipsoid zone, rEZ1mm: the average of rEZ indices of 5 line scans within 1 × 1-mm area of the fovea, LogMAR: logarithm of the minimum angle of resolution, VA: visual acuity, rEZave: the average of rEZ indices of 13 line scans within 3 × 3-mm area, SE: standard error, MS: mean sensitivity.

