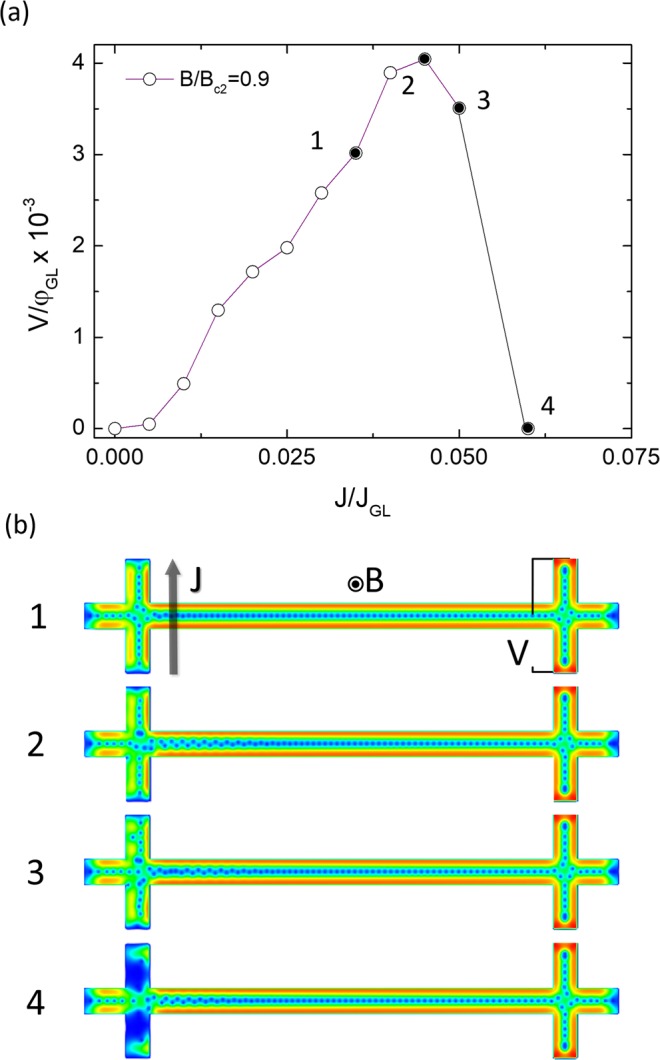
Figure 6.

Current-voltage characteristics. (a) V(J) curves at field B = 0.9Bc2, obtained from TDGL simulations, where black dots indicate characteristic features of vortex dynamics. (b) Snapshots of the vortex dynamics at four points corresponding to (a). (1) Regular non-local vortex motion along the nanowire, for J in the range J*(B) < J < Jc(B) (2) the maximal voltage at J = Jc(B), (3) state of high dissipation for J > Jc, (4) snapshot just before completing the transition to the normal state.
