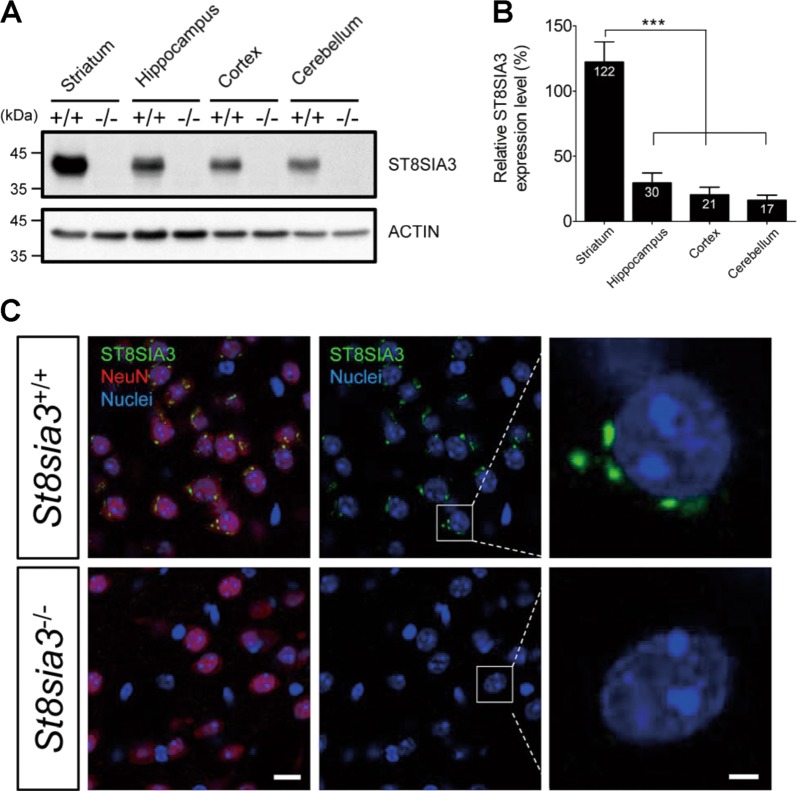
Fig. 1. ST8SIA3 is highly expressed in the striatum and is located in NeuN-positive neurons.
Brain samples from WT (+/+) and St8sia3-KO (−/−) mice were subjected to immunoblotting and immunofluorescence analysis. a Immunoblotting of ST8SIA3 from different regions of the mouse brain. The total protein loaded was 30 μg from the striatum, hippocampus, cortex and cerebellum. The data shown are representative of three mice of each genotype. b Relative intensity was calculated by using Image J software. n = 3 for each genotype. ***P < 0.001 (one-way ANOVA followed by Bonferroni’s multiple comparison tests). All values are presented as the means ± S.E.M. c Immunofluorescence staining for ST8SIA3 localization (green) and chromatin (Hoechst 33342, blue) in brain sections. Images were captured from striatal regions. The sections were costained with cell-specific markers (red) to help differentiate neurons (NeuN), astrocytes (S100 beta, Supplementary Fig. S1E) and glial cells (Iba1, Supplementary Fig. S1E). ST8SIA3 was detected only in the cytoplasm of NeuN-positive neurons. The data shown are representative of three mice of each genotype. Scale bars, 10 μm (merged panels) and 2 μm (enlarged panels)

