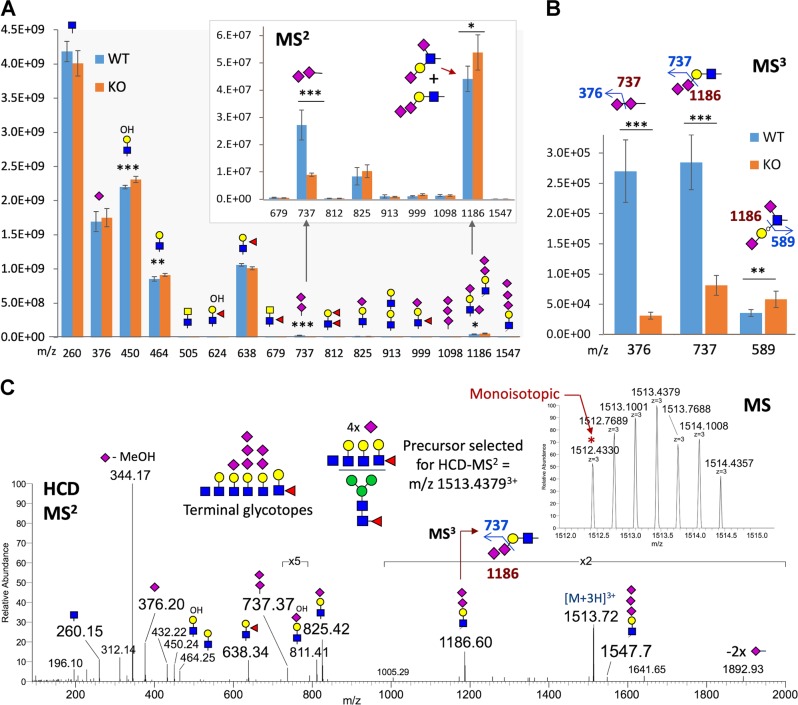
Fig. 2. St8sia3 depletion impaired the addition of terminal sialylated units to striatal N-glycans.
Permethylated N-glycans derived from WT (+/+) and St8sia3-KO (−/−) striatal tissues were subjected to a nanoLC-MS2-product-dependent MS3 analysis, in which the MS2 fragment ions representing NeuAc2+ (m/z 737) and NeuAc2-Hex-HexNAc+ (m/z 1186) were additionally selected for MS3 analyses upon detection. a The summed intensity of a panel of diagnostic MS2 ions allowed the rapid assessment of the relative abundance of each glycotope at the glycomic level, as annotated by cartoon symbols and respective m/z values indicated on the x-axis. The magnified panel showed a significant reduction in the level of the m/z 737 ion in St8sia3-KO mice. b The summed intensity of the diagnostic MS3 ions that verified the NeuAc-NeuAc disialyl unit, i.e., m/z 376 from 737 and m/z 737 from 1186, indicated a drastic reduction in St8sia3-KO mice, whereas the ions that identified a type 1 chain sialylated at 2 distinct positions, i.e., m/z 589 from 1186, actually increased. The cartoon drawings illustrate how these diagnostic MS3 ions validated and added confidence to the identification of the isomeric disialylated glycotopes. c A search of the LC-MS2/MS3 data for presence of terminal trisialylated LacNAc using the diagnostic ions at m/z 1547 led to the identification of multisialylated N-glycans in the WT samples, but not the St8sia3-KO samples, and these antennary glycotopes were observed at low level, along with other permutations of mono- and disialylated antennary glycotopes. The inset shows the correct monoisotopic mass for the selected precursor ion, while the HCD MS2 spectrum contained the complement of oxonium ions, supporting the assigned glycosyl composition, including an ion at m/z 1186 that was further selected for MS3 and yielded a product at m/z 737. Glycomic mapping of striatal N-glycans revealed a significant reduction in the number of terminal disialyl units in St8sia3-KO mice. n = 3 for each genotype with duplicates. *P < 0.05, **P < 0.01 and ***P < 0.001, as compared with WT control (two-tailed unpaired Student’s t-test). All values are presented as the means ± S.E.M

