
Figure 3.
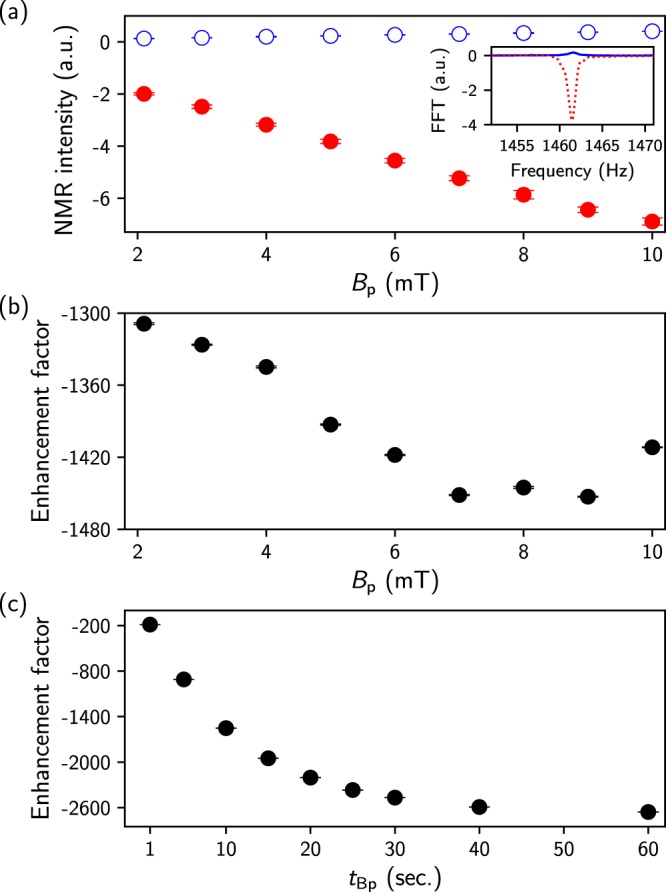
SABRE-enhanced 1H NMR results. (a) NMR intensity as a function of the Bp strength obtained with a fixed time (tBp = 10 s). The inset shows the FFT spectra with (dashed line) and without (solid line) p-H2 flowing at 8 mT Bp. (b) Enhancement factor versus Bp. (c) Enhancement factor as a function of the Bp time (tBp) obtained at 8 mT Bp. All data were measured four times at each point. Error bars represent the standard error of repeated measurements. NMR intensities were obtained with a real spectrum area and phase correction at each data point. The enhancement factors were calculated with the additional considerations of the volume and nuclear spin ratios of pyridine and methanol.