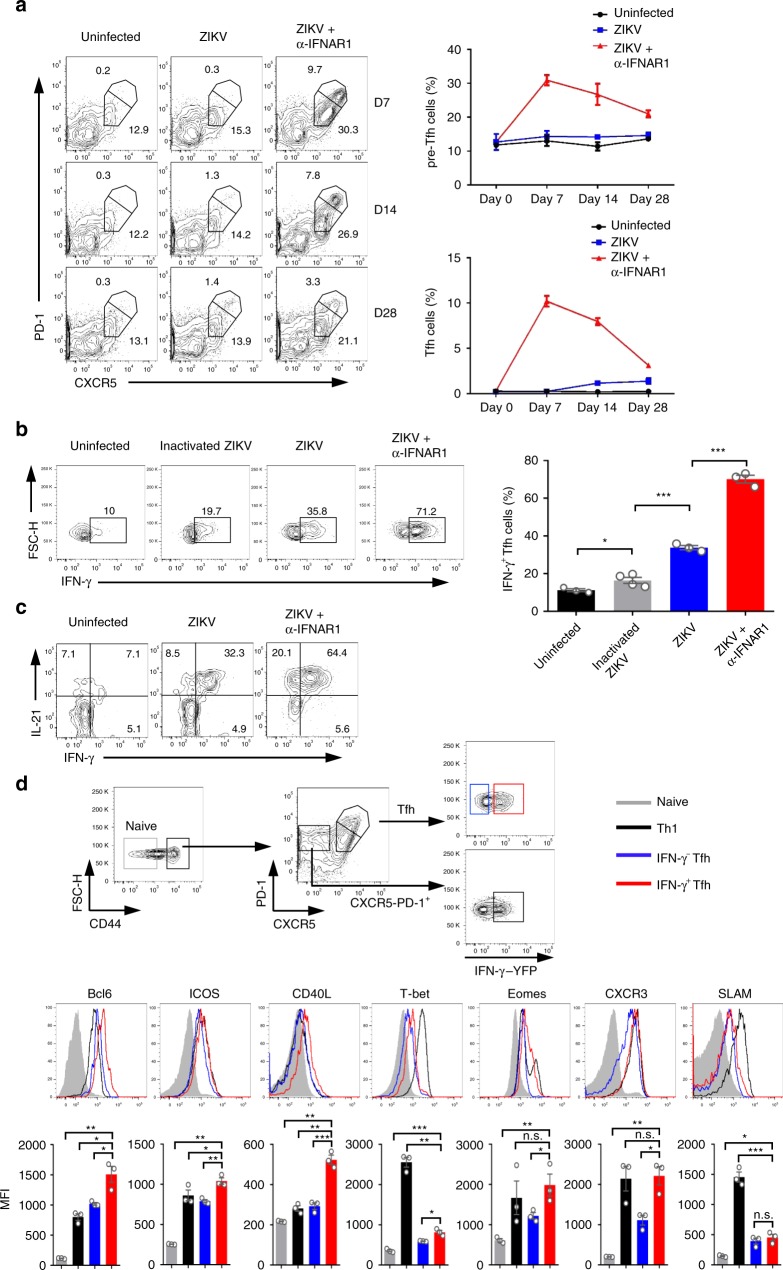
Fig. 2.
ZIKV infection induces a robust Th1-like Tfh response. a BALB/c mice were administered with PBS control, ZIKV, or ZIKV + anti-IFNR1 as in Fig. 1, and splenocytes were harvested on 7, 14, and 28 dpi for staining with different surface markers (n = 3 for each group). Representative flow cytometry plots of CXCR5highPD-1high Tfh cells and CXCR5mediumPD-1medium pre-Tfh cells gated from CD4+CD44highCD62Llow activated T cells (left panel); with summary of the kinetic changes of Tfh cells and pre-Tfh cells (right panel). b BALB/c mice were administered with PBS control, inactivated ZIKV, ZIKV only, or ZIKV + anti-IFNR1, and the IFN-γ expression of CXCR5highPD-1high Tfh cells were analyzed on day 7 after ZIKV infection (n = 3–4 for each group). Representative flow cytometry plots of IFN-γ+ cells in CXCR5highPD-1high Tfh cells were presented as IFN-γ+ Tfh cells (left panel); and the percentages of IFN-γ+ Tfh cells in each experimental group were summarized with bar charts (right panel). c Representative flow cytometry plot of the percentage of cells expressing IL-21 and IFN-γ in CXCR5highPD-1high Tfh cells in each group of mice. d Gating strategy of naive cells, Th1 cells, IFN-γ− Tfh and IFN-γ+ Tfh cells in IFN-γ-YFP reporter mice (top panel); the expression of Bcl6, ICOS, CD40L, T-bet, Eomes, CXCR3, and SLAM in each T cell subsets (middle panel). Mean fluorescence intensity (MFI) of each protein was summarized with bar graph (bottom panel) (n = 3 for each group). The summary data were presented as mean ± SEM. Statistical differences were determined by Student’s t test and p values were indicated by *p < 0.05, or **p < 0.01, or ***p < 0.001. Data shown represent two (a–d) independent experiments. Source data are provided as a Source Data file

