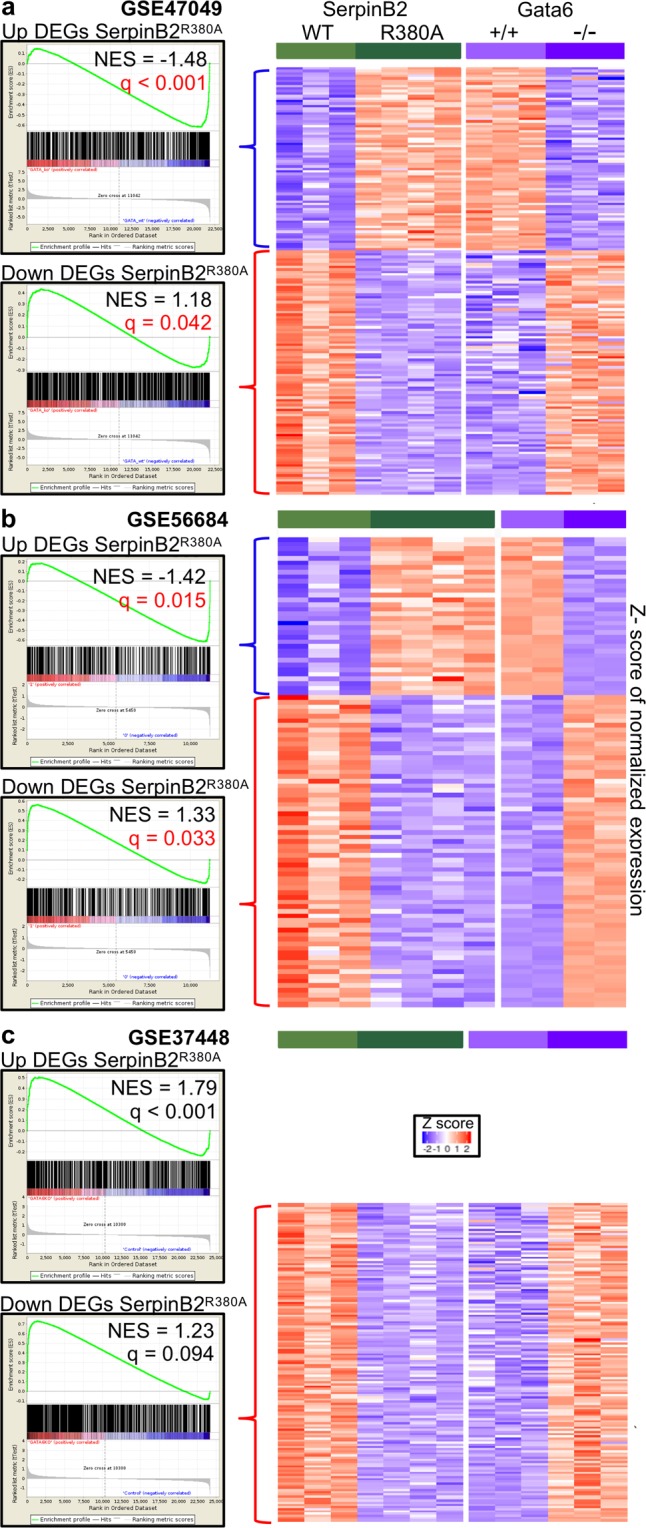
Figure 6.

GSEA using microarray data sets from Gata6−/− LPM. The 624 up-regulated and the 857 down-regulated DEGs in SerpinB2R380A RPM were compared by GSEA with 3 microarray data sets that compared LPM from Gata6+/+ and Gata6−/− mice; (a) GSE47049, (b) GSE56684 and (c) GSE37448. GSEAs showing significant counter-regulation (i.e. up in SerpinB2R380A and down in Gata6−/− or down in SerpinB2R380A and up in Gata6−/−) are indicated with red p values. Heat maps of core enriched genes showing counter-regulation are shown for (a,b) and for Down DEGs in (c), which showed counter-regulation that did not reach significance (q = 0.094). Up DEGs in (c) showed co-regulation (positive NES score) indicating no significant counter-regulation. The core enriched genes illustrated by the heat maps are listed in Table S1h.
