Figure 1.
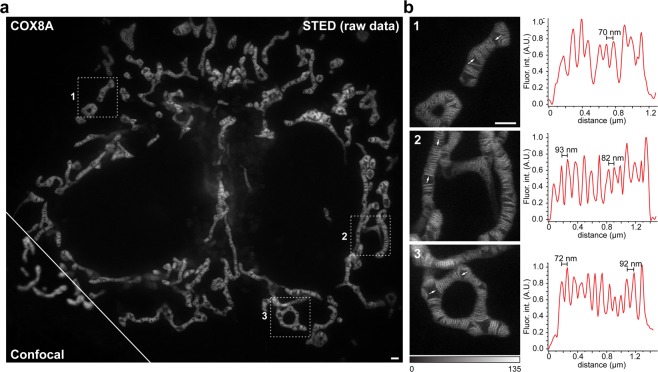
Live-cell Stimulated Emission Depletion (STED) nanoscopy of mitochondrial cristae in HeLa cells. HeLa cells stably expressing COX8A-SNAP fusion proteins were labeled using SNAP-Cell SiR and visualized with STED nanoscopy. (a) Overview of HeLa cells. Shown is a comparison between confocal and STED resolution. (b) Left: Magnifications of the areas indicated in the overview image. Right: Fluorescence intensity line profiles measured as indicated in the magnifications. STED images show unprocessed raw data without background subtraction. Scale bars: 1 µm.

