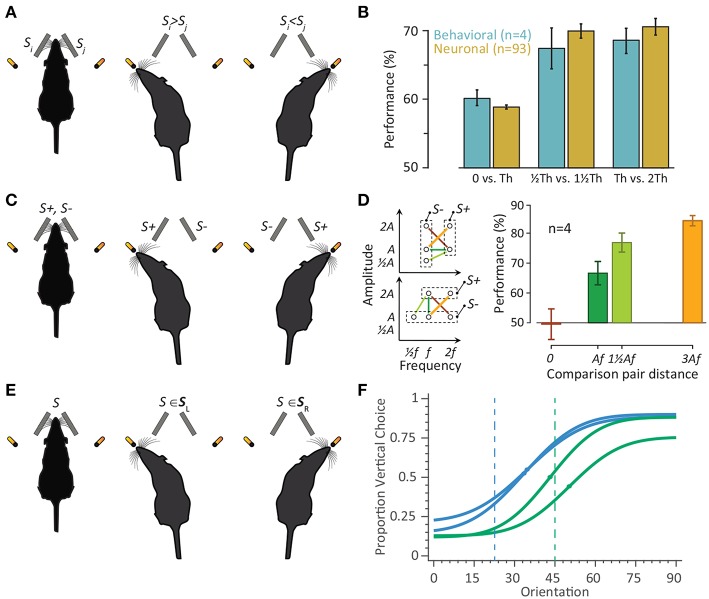
Figure 4.
The two-alternative-choice behavioral tasks in rodents. (A) Schematic representation of the comparative discrimination paradigm. On every trial, two vibrations Si and Sj were presented. (B) Four rats were trained in the detection/discrimination task to identify the vibration with the higher amplitude. The neuronal performance is the average performance (based on the area under ROC) across single-units (n = 35) and multiunit clusters (n = 58) from Adibi and Arabzadeh (2011). For each neuron, the stimulus intensity whose detection performance was closest to 60% was chosen as detection threshold (Th). The stimuli corresponding to −, −, and 2-fold Th were then selected for estimating the discrimination performances. The same threshold of 60% defined as detection threshold for rats. The rats performed the comparison task between 0−Th, and Th − 2Th. Error bars indicate standard error of means across rats or neurons. (C) Schematic representation of the categorical discrimination paradigm. Stimuli were defined as either S+ or S−. In each trial, one of the two vibrations was S+ and the other was S−. Having identified the S+ vibration, the rodent expressed its choice by turning toward the corresponding drinking spout. (D) (Left) Stimulus space. Each circle represents the frequency–amplitude combination of one stimulus. Two groups of rats were trained in the task. For one group (top-left), two frequencies (f = 80 Hz and 2f = 160 Hz) and three amplitudes ( = 8 μm, A = 16μm, and 2A = 32 μm) were used to generate five vibrations, and for second group (bottom-left) three frequencies ( = 40 Hz, f = 80 Hz and 2f = 160 Hz) and two amplitudes (A = 16 μm and 2A = 32 μm) were used to generate five vibrations. Stimuli that were presented together and had to be discriminated (paired stimuli) are connected by lines. The right panel shows the proportion of correct trials (performance) for the corresponding four stimulus-pairs averaged across rats. Error bars are s.e.m. across rats. Re-plotted from (Adibi et al., 2012). (E) The schematic representation of the categorization paradigm. The stimuli are divided into two categories of SL and SR, corresponding to left and right choices, respectively. A stimulus S was presented on every trial. The rat identifies the category which stimulus S belongs to. (F) Rats were trained to categorize the orientation of a 9.8 cm-diameter disc with alternating ridges and grooves by licking at one of the two reward spouts. Psychometric functions correspond to two rats trained to categorize orientations 0–45° as horizontal, and 45–90° as vertical (green), and another two rats trained to categorize orientations 0–22.5° as horizontal, and 22.5–90° as vertical (blue). The curves correspond to a Gaussian cumulative function fitted to data. The dots on each curve represent the perceptual decision boundary of each rat. The blue and green vertical dashed lines represent the categorization boundaries of 22.5° and 45°, respectively.

