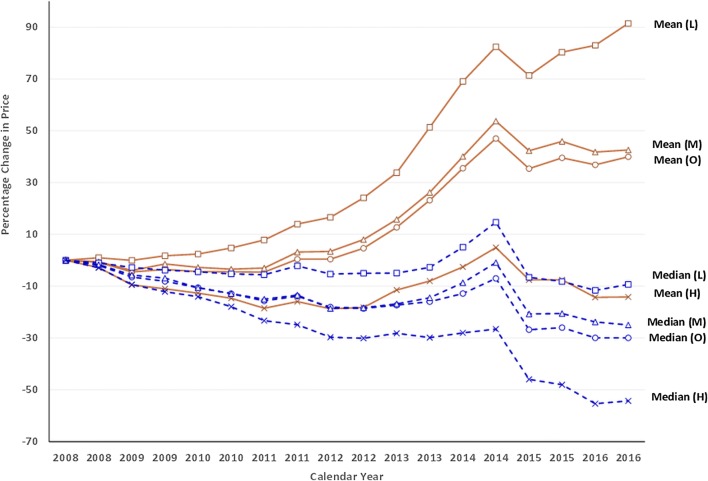
Figure 1.
Mean and median percentage change in generic drug prices, 2008–2016 for the overall cohort of generic drugs, and within terciles of prescribing frequency. Drug prices were estimated for 1099 generic drugs for the 14 study periods (not adjusted for inflation). Prices estimated in the first half of 2008 were used as reference. Baseline prescribing frequency was estimated by dividing the number of study-drug dispensings by the total number of dispensings in the baseline period; using terciles, study drugs were grouped into three prescription frequency groups, with the highest tercile corresponding to the most commonly prescribed drugs. The red line represents the mean change in prices and the blue median. The lowest-, middle-, and highest-prescribing frequency groups are represented by (L), (M), and (H) respectively, while the overall cohort is represented with (O).

