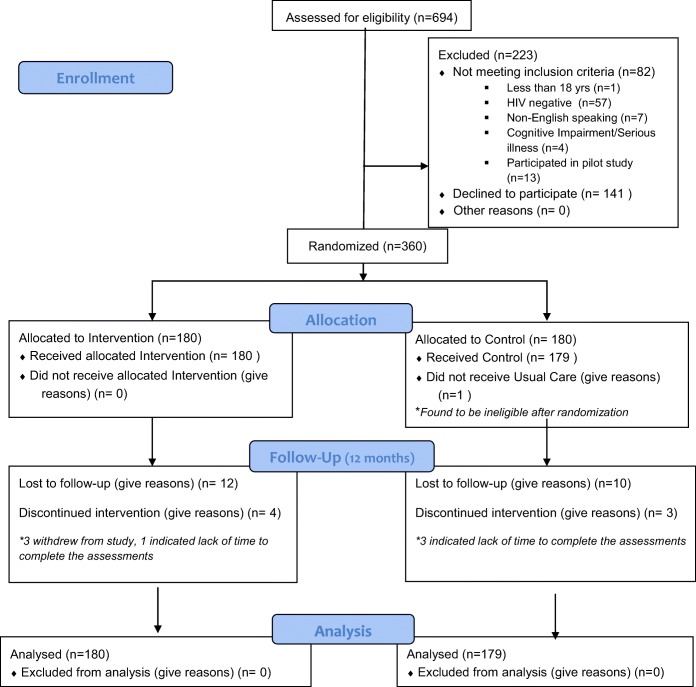
Fig. 1.
Figure 1. The GREAT study participant flow diagram. Figure 1 contains poor quality of text inside the artwork. Please do not re-use the file that we have rejected or attempt to increase its resolution and re-save. It is originally poor, therefore, increasing the resolution will not solve the quality problem. We suggest that you provide us the original format. We prefer replacement figures containing vector/editable objects rather than embedded images. Preferred file formats are eps, ai, tiff and pdf."Figures 1 please confirm if captured correctly.attached

