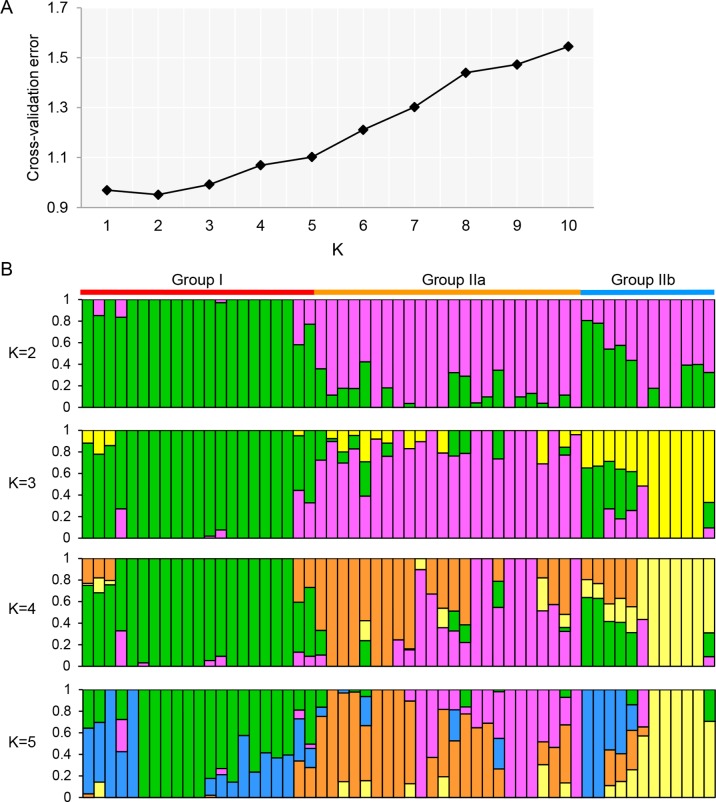
Figure 2.
Population structure analyses of 57 olive cultivars based on the GBS-SNP genotyping. (A) Cross-validation plot for the number of population (K) values. The X-axis and Y-axis represented the different K values (K = 1–10) and cross-validation error. (B) Stacked bar plot for the K value = 2, 3, 4, and 5. The population structure analysis was performed by admixture 1.3 (Alexander et al., 2009). The X-axis represented the individual cultivar with K colored segments and the Y-axis represented the ancestry qi proportion, correspondingly.

