Figure 5.

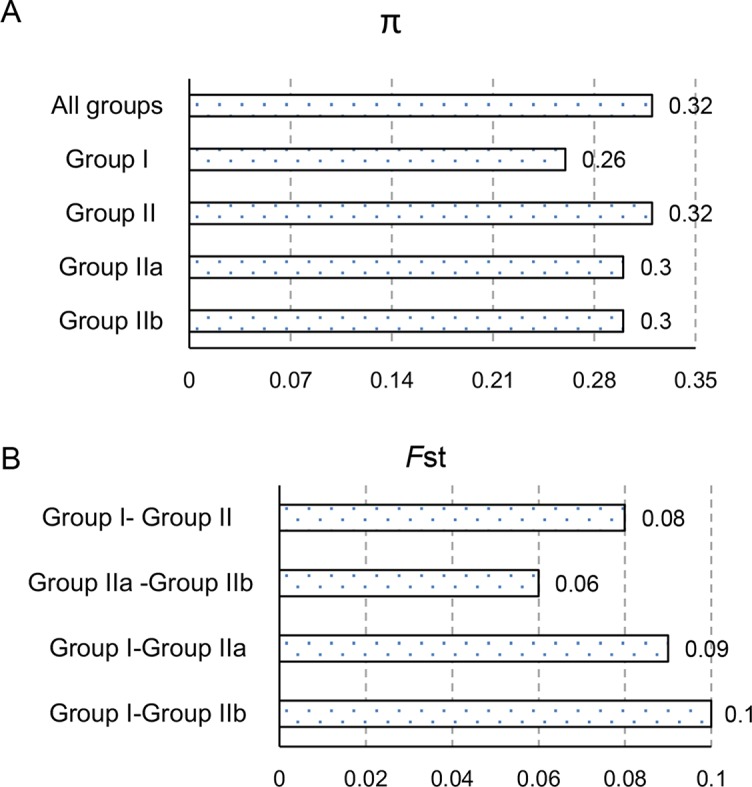
Genetic diversity analyses of different olive groups. The levels of nucleotide diversity, π (A) and fixation index, F ST (B) between groups were calculated using VCFtools (https://vcftools.github.io/).

Genetic diversity analyses of different olive groups. The levels of nucleotide diversity, π (A) and fixation index, F ST (B) between groups were calculated using VCFtools (https://vcftools.github.io/).