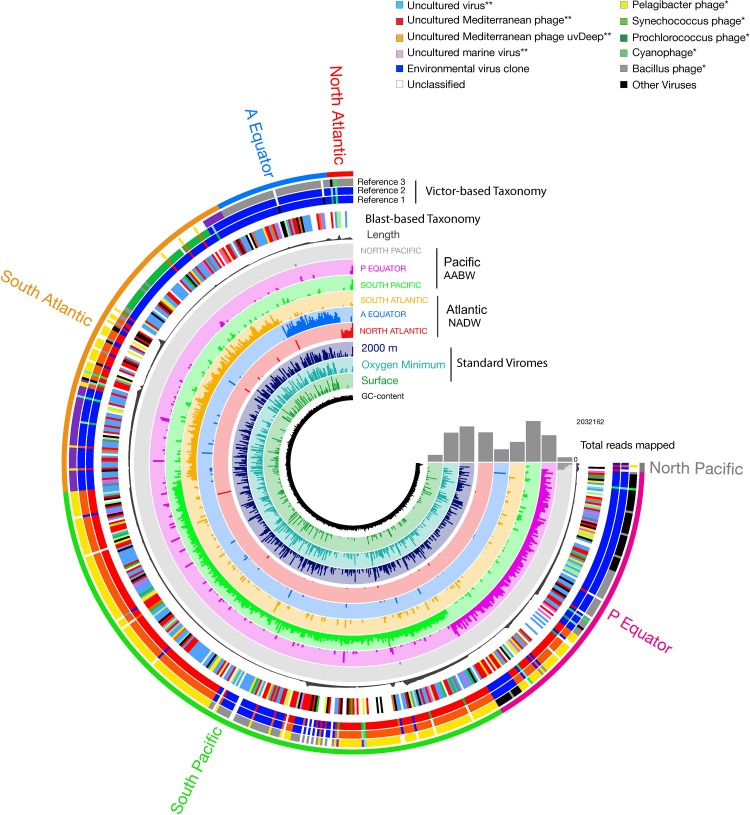
FIGURE 5.
Coverage of viral contigs in NADW and PAABW samples. Coverage in the three standard virome samples from the North Atlantic surface, oxygen minimum and 2000 m is indicated in 2–4 inner rings, respectively. Length of the contigs (gray bar, in bp). The height of the colored bars within a ring represents the mean coverage (second and third quartile) of a contig in a given sample. The samples were ordered by geographic location following the deep-water conveyor belt circulation. The first outer ring indicates the taxonomic classification of the viral contigs based on BLASTx at class (∗∗), and at the genus (∗) level. The next 2 to 4 outer rings indicate the taxonomic classification based on VICTOR, showing the three most relevant identified references that clustered with the viral contigs.

