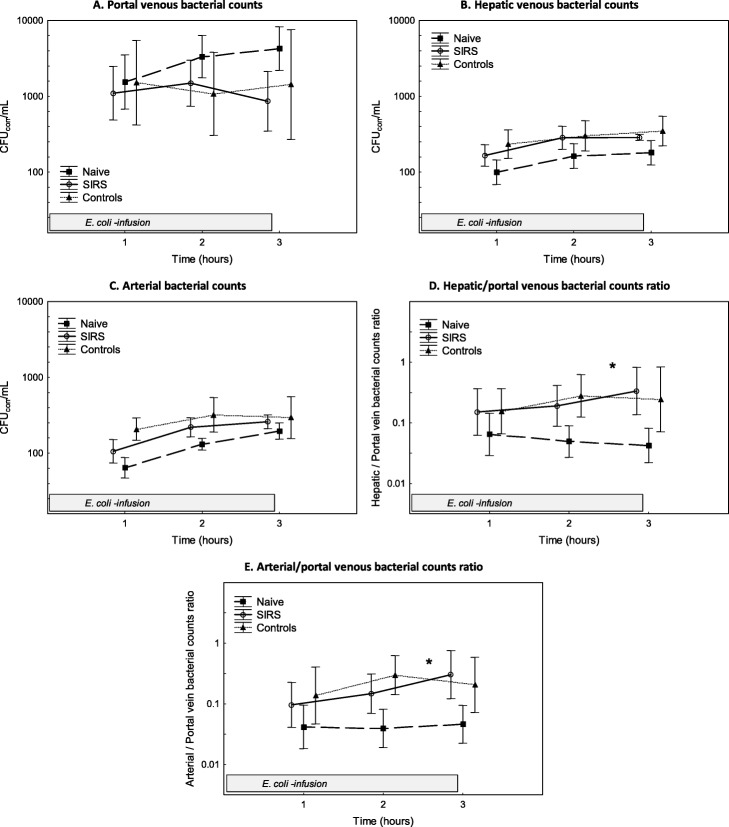
Fig. 2.
Bacterial counts in the distal portal vein, the hepatic vein and the artery during the E. coli infusion (a–c). The ratio of hepatic to portal venous bacterial counts and the ratio of arterial to portal venous bacterial counts during the E. coli infusion (d, e). Values are expressed as mean ± SEM (standard error of the mean). *p < 0.05. Difference between the SIRS and naive group as assessed with ANOVA III for repeated measurements

