Figure 7.
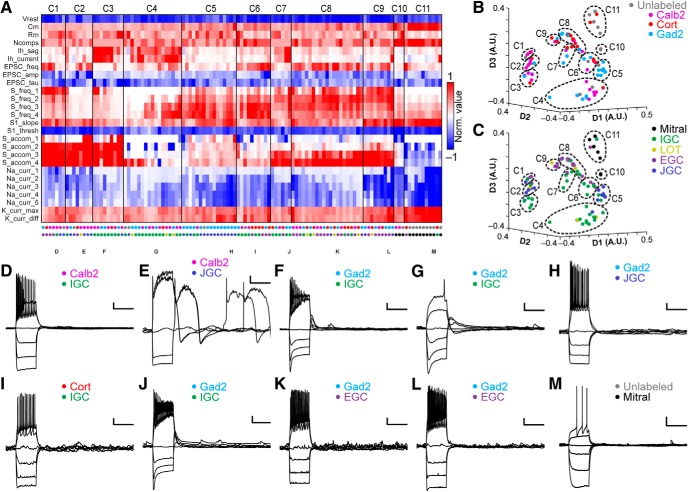
Multidimensional analysis across AOB neuronal types. A, Cluster analysis of the 118 interneurons and mitral cells for which all 26 physiologic properties were obtained. Normalized values were calculated as per Figure 3. Row labels refer to intrinsic properties listed in Table 1. Each column represents a single cell, and column labels are color coded based on genetically defined type and morphologically defined type. Clusters are separated by solid vertical lines. B, C, Nonclassical multidimensional scaling of the cell properties shown in A, colorized by genetically defined type (B) and morphologically defined type (C). Dashed outlines indicate approximate cluster boundaries. C1–C11 refer to the cluster definitions in A. D–M, Current clamp responses to the same current injection series shown in Figures 2, 4, 6 from selected cells as noted below the columns in A. Scale bars: 10 mV, 500 ms.

