Figure 2.
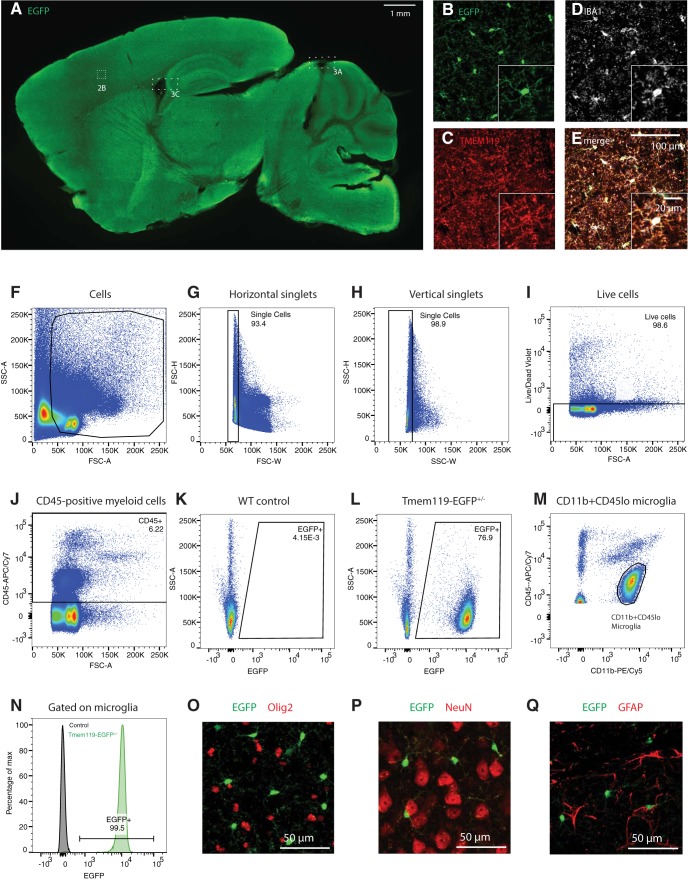
EGFP labels microglia in all regions across the brain. A, Representative epifluorescence image of a sagittal section of a P25 Tmem119-EGFP+/− mouse stained with an anti-GFP antibody for improved signal-to-noise ratio (data for 1 of 3 mice shown). B–E, High-power confocal micrographs of native EGFP fluorescence (B, green) in TMEM119 (C, red) and IBA1 (D, white) microglia in the cortical region outlined in A. FIJI-calculated composite image showing all three labels (E). Boxes 3A and 3B Boxes cross-reference areas shown in Figure 3. F–J, Flow cytometry analysis showing gating for of single, live, CD45-positive cells (1 of 3 independent experiments shown). Numbers in or adjacent to outlined areas indicate percentage cells in each gate. K, L, Representative density plots showing EGFP expression in WT and Tmem119-EGFP+/− mice (pre-gated on CD45+ cells). M, Representative density plot showing CD11b+CD45lo cells corresponding to microglia (pre-gated on CD45+ cells). N, Histogram showing fraction of CD11b+CD45lo microglia expressing EGFP. O–R, Representative immunostaining for oligodendrocytes (O; Olig2, red), neurons (P; NeuN, red), and astrocytes (Q; GFAP, red) in EGFP-expressing Tmem119-EGFP+/− mice. One of three independent experiments shown.

