Figure 6.
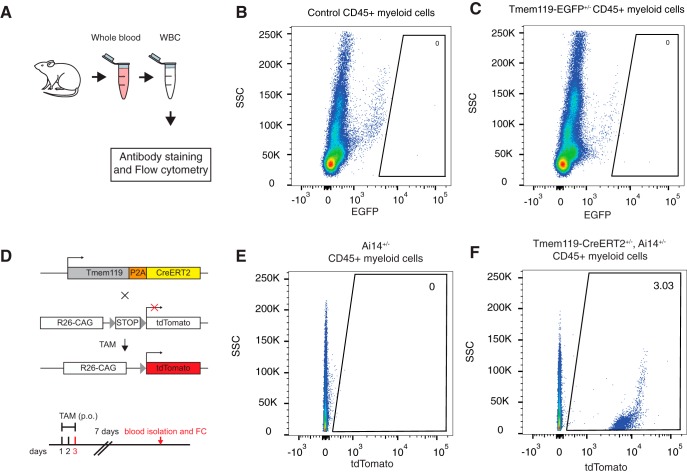
Blood monocyte profiling in Tmem119 knock-in mice. A, Experimental approach for flow cytometry of monocytes isolated from whole blood. B, C, Representative flow cytometry analysis of EGFP expression in pre-gated single live CD45+ cells in WT control (B) and Tmem119-EGFP+/− mice (C). One of three experiments is shown (N = 3 mice). Numbers in or adjacent to outlined areas indicate percentage cells in each gate. D, Adult mice of Tmem119-CreERT2+/−; Ai14(RCL-tdT)-D+/− mice received tamoxifen (TAM) per os (p.o.) for 3 d. The mice were sacrificed 7 d after the last dose for flow cytometry (FC). E, F, Representative flow cytometry analysis of tdTomato expression in pre-gated single live CD45+ cells in Ai14(RCL-tdT)-D+/− (E) and Tmem119-CreERT2+/−; Ai14(RCL-tdT)-D+/− mice (F). One of two independent experiments is shown (N = 3 mice).

