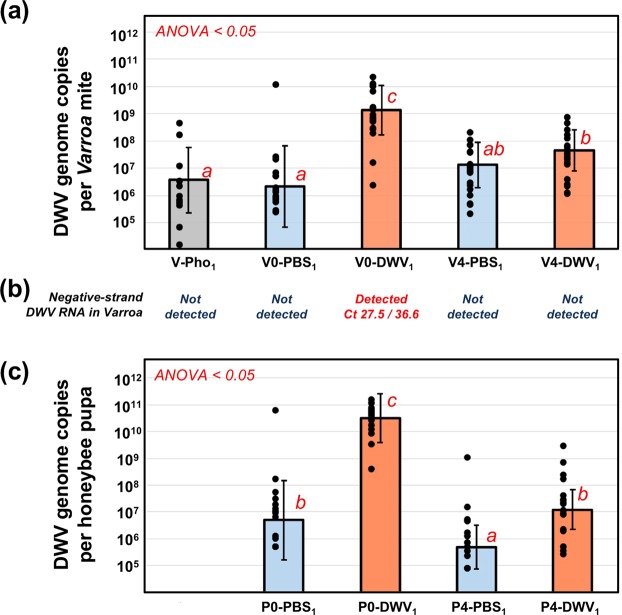
Figure 3.
Dynamics of DWV RNA accumulation in Varroa destructor mites and honey bee pupae from Experiment 1: “Varroa mite DWV acquisition experiment”. (a,c) Average DWV RNA copies per (a) Varroa destructor mites, and (b) honey bee pupae, ± SD. Red letters above the bars indicate significantly and non-significantly different groups (ANOVA). Treatment groups are named as in the Fig. 1. Individual mite and pupa copy numbers indicated by black dots. Corresponding mite (a) and pupae (c) groups are aligned vertically. (b) Detection of negative strand DWV RNA in Varroa mite groups. The Ct values shown are as follows: Assay 1/Assay 2.

