. 2019 Mar 20;43(4):474–486. doi: 10.4093/dmj.2018.0171

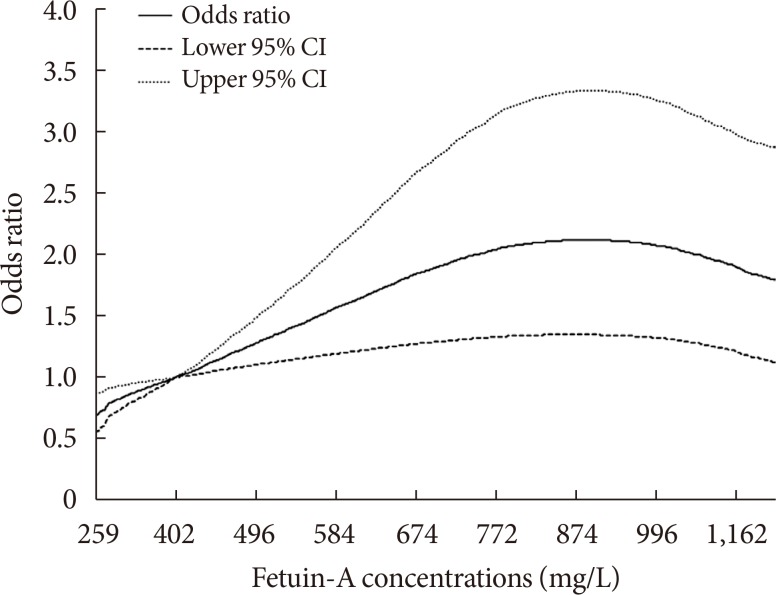
Fig. 1. Spline analysis of the association between fetuin-A concentrations and incident type 2 diabetes mellitus risk. The solid line represents point estimates of relative risk for the association between fetuin-A levels and risk of incident type 2 diabetes mellitus, and the dotted lines represent the upper and lower bound of 95% confidence interval (CI). Study participants with the highest 5% of fetuin-A were excluded to minimize the potential impact of outliers. Cubic spline analysis was used to examine the association between fetuin-A concentrations and risk of developing type 2 diabetes mellitus using the model 1 from Table 2 (P nonlinearity=0.005).

Fig. 1