Experimental advances have enabled the acquisition of tandem mass spectrometry and metagenomics sequencing data from tens of thousands of environmental/host-oriented microbial communities. Each of these communities contains hundreds of microbial features (corresponding to microbial species) and thousands of molecular features (corresponding to microbial natural products). However, with the current technology, it is very difficult to identify the microbial species responsible for the production/biotransformation of each molecular feature. Here, we develop association networks, a new approach for identifying the microbial producer/biotransformer of natural products through cooccurrence analysis of metagenomics and mass spectrometry data collected on multiple microbiomes.
KEYWORDS: natural products, association network, biotransformation, mass spectrometry, metagenomics, microbiome, xenobiotic
ABSTRACT
The human microbiome consists of thousands of different microbial species, and tens of thousands of bioactive small molecules are associated with them. These associated molecules include the biosynthetic products of microbiota and the products of microbial transformation of host molecules, dietary components, and pharmaceuticals. The existing methods for characterization of these small molecules are currently time consuming and expensive, and they are limited to the cultivable bacteria. Here, we propose a method for detecting microbiota-associated small molecules based on the patterns of cooccurrence of molecular and microbial features across multiple microbiomes. We further map each molecule to the clade in a phylogenetic tree that is responsible for its production/transformation. We applied our proposed method to the tandem mass spectrometry and metagenomics data sets collected by the American Gut Project and to microbiome isolates from cystic fibrosis patients and discovered the genes in the human microbiome responsible for the production of corynomycolenic acid, which serves as a ligand for human T cells and induces a specific immune response against infection. Moreover, our method correctly associated pseudomonas quinolone signals, tyrvalin, and phevalin with their known biosynthetic gene clusters.
IMPORTANCE Experimental advances have enabled the acquisition of tandem mass spectrometry and metagenomics sequencing data from tens of thousands of environmental/host-oriented microbial communities. Each of these communities contains hundreds of microbial features (corresponding to microbial species) and thousands of molecular features (corresponding to microbial natural products). However, with the current technology, it is very difficult to identify the microbial species responsible for the production/biotransformation of each molecular feature. Here, we develop association networks, a new approach for identifying the microbial producer/biotransformer of natural products through cooccurrence analysis of metagenomics and mass spectrometry data collected on multiple microbiomes.
INTRODUCTION
The human microbiome is a complex community of microorganisms, their enzymes, and the molecules they produce/modify. Recent studies show that imbalances in human microbial ecosystems can cause disease. The majority of relationships between the microbiome and disease were discovered through microbiome-wide association studies that link disease to a relative overabundance/underabundance of microbial species using metagenome sequencing data (1, 2). However, these studies fail to determine the molecular mechanism of disease.
Metabolomics studies have shown that among all the molecules in the human metabolome, microbial metabolites are the ones most altered in metabolic and inflammatory disorders (3). These molecules include the biosynthetic products of microbiota (microbial natural products) and the microbial modifications of host, dietary, and drug molecules (microbial biotransformation products) (4).
Currently, the majority of known microbial products and biotransformation products are discovered through the targeted analysis of specific molecules, such as short-chain fatty acids, secondary bile acids, and oral drugs in model systems (e.g., mice with a controlled diet and environment) (5–7). However, these methods do not generalize to complex communities like the human microbiome, where it is impossible to control environmental factors. Moreover, targeted metabolomics analysis cannot detect novel microbial metabolites.
Recent large-scale microbiome data sets, such as the Integrative Human Microbiome Project (iHMP) (8) and the American Gut Project (AGP) (9), collect microbial and molecular abundance profiles over thousands of human microbiota samples, providing us with an unprecedented opportunity to explore the interactions between microorganisms, enzymes, and molecules in complex communities. In these projects, the abundances of tens of thousands of microbial strains/species are measured using microbial marker gene amplicon sequencing and whole-metagenome or metatranscriptome shotgun sequencing (10), and the abundances of tens of thousands of molecules are measured using untargeted liquid chromatography-mass spectrometry (LC-MS) (11). Recently, new methods have been proposed for finding associations between microbial and molecular features through the correlations of their abundance profiles across multiple microbiome samples (12, 13). However, these methods fail to extend to thousands of microbiome samples. In addition, there is no consensus on how to extract features from LC-MS data or what association test should be used.
In this study, we develop an efficient pipeline to discover potential microbial metabolites and microbial biotransformations by building a cooccurrence network of microbes and metabolites using high-throughput LC-MS data and metagenomics data collected over thousands of microbiota samples. Using this strategy, we identify several microbial products and microbial biotransformation products from the human microbiome. Moreover, we develop a new method for computing the false discovery rates (FDR) of the associations and using them to benchmark various metabolomics feature extraction methods and association tests. Furthermore, we develop a new method to detect clade-specific metabolites based on the cooccurrence network and the analysis of a microbial phylogenetic tree.
RESULTS
Outline of the pipeline.
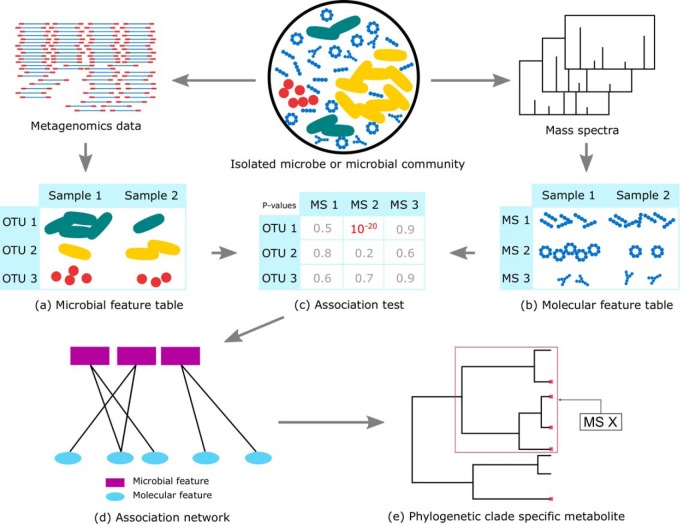
Our pipeline (Fig. 1) includes the following: (a) extracting microbial features, which could be either operational taxonomic units (OTUs) or biosynthetic gene cluster (BGC) families, (b) extracting molecular features, which could be either mass spectrometry (MS) features or tandem mass spectrometry (MS/MS) features, (c) searching for pairs of associated features and computing false discovery rates, (d) constructing the association network, and (e) assigning molecular features to phylogenetic clades.
FIG 1.
The pipeline includes the following steps: extracting microbial (a) and molecular (b) features from the raw data, searching for pairs of associated features and computing false discovery rates (c), constructing the association network (d), and assigning molecular features to phylogenetic clades (e).
Data sets.
The AGP data set consists of LC-MS/MS and 16S rRNA data collected from the human gut microbiomes of 2,125 subjects. For a subset of these samples, shotgun metagenomics data are also available. Optimus extracted 29,567 molecular features from the LC-MS data (MinIntensity = 1,000), and MS-Clustering extracted 74,913 molecular features from the LC-MS/MS data (cosine similarity threshold [τ] = 0.4). We further applied deduplication using an m/z threshold of 0.01 and a Fisher’s exact test P value threshold of 10−5. This decreased the number of molecular features from 29,567 to 18,940 for Optimus and from 74,913 to 73,275 for MS-Clustering. We additionally annotated the extracted molecular features using spectral library search (14) and Dereplicator+ (15). Using the Greengenes Database (16) as the reference, QIIME extracted 11,265 unique OTUs from the AGP data set (MinCount = 0).
The data set for human microbiome isolates from cystic fibrosis patients (HUMAN-CF) consists of tandem mass spectrometry and metagenomics data collected from 243 microbial isolates from cultures of sputum samples from cystic fibrosis patients (Global Natural Product Social Molecular Networking [GNPS] data set MSV000080251). Each sample contains one or a mixture of a few (from 1 to 11) different bacteria. Based on the metagenomics data of HUMAN-CF, Quinn et al. (17) analyzed the association between microbial species and discovered that Pseudomonas and Staphylococcus aureus are anticorrelated with Gram-positive anaerobes. In this study, we obtained 23,176 molecular features from LC-MS/MS data (see Materials and Methods for details). We further applied SPAdes (18), antiSMASH (19), and BiG-SCAPE (20) to the shotgun metagenomics data and extracted 18 nonribosomal-peptide BGC families which are present in at least 10 samples.
Microbial products and biotransformation products.
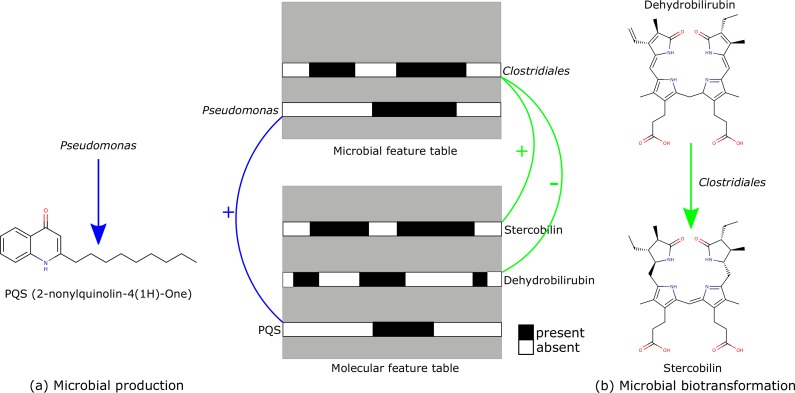
Microbial natural products can be detected as positive correlations between the occurrence of the microbial species and the molecules in the association network (Fig. 2a). In addition to the microbial products, the association network also reveals many microbial biotransformation products. Microbial biotransformation products are distinguished by a strong negative correlation between the occurrences of the microbial species and the precursor molecules, along with strong positive correlations between the microbial species and the product molecules (Fig. 2b).
FIG 2.
(a) Microbial natural products can be detected as positive correlations between the occurrences of the microbial species and the molecules in the association network. (b) Microbial biotransformation products can be detected as negative correlations between the microbial species and the precursor molecules, along with positive correlations between the microbial species and the product molecules. The feature tables are mock-up data.
We applied the association network pipeline to the AGP data set and found 18,623 and 8,178 associations with a P value threshold (PThreshold) of 10−10 for the molecular features obtained by Optimus and MS-Clustering, respectively. To explore the power of the association network (Fig. 3) in detecting microbial products and biotransformation products, we further searched the mass spectra against AntiMarin (21), the Dictionary of Natural Products database (22), and the Human Metabolome Database (23) using Dereplicator+ and analyzed the densely connected modules of this network that contained the molecules annotated by Dereplicator+ (Fig. 3).
FIG 3.
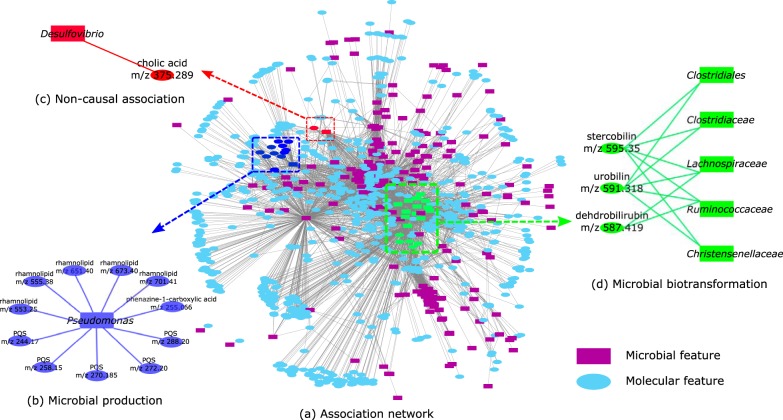
(a) Association network of AGP. (b) Pseudomonas bacteria are positively associated with phenazine-1-carboxylic acid, rhamnolipids, and PQS. (c) The correlation between Desulfovibrio and cholic acid is noncausal. (d) Clostridiales biotransform bile acids. Here, we combined the nodes that represent the same molecules or taxa in the same family.
Correlating mass spectral data to 16S rRNA data.
At a PThreshold of 10−10, microbial features from the Pseudomonas genus are positively associated with phenazine-1-carboxylic acid (m/z 225.07), five rhamnolipids, and five pseudomonas quinolone signals (PQS) (Fig. 3b). Among the 42 rhamnolipids with unique masses produced by Pseudomonas (24), 8 are included in the GNPS spectral library. A spectral library search found four of the rhamnolipids in the AGP data set, and two (m/z 673.40 and m/z 701.41) are significantly associated with Pseudomonas. With molecular networking (14, 25), two more rhamnolipids were identified (m/z 553.25 and m/z 555.38), both of which have a strong association with Pseudomonas. Pseudomonas is also significantly associated with rhamnolipid B (m/z 651.40). Moreover, Pseudomonas is positively correlated with compounds from different series of quinolones (26), including 4-hydroxy-2-heptylquinoline-N-oxide (m/z 258.15), 2-nonyl-4-quinolone (m/z 270.19), 2-nonylquinolin-4(1H)-one (m/z 272.20), 4-hydroxy-2-nonylquinoline-N-oxide (m/z 288.20), and 4-hydroxy-2-heptylquinoline (HHQ) (m/z 244.169). All of these molecules are known to be produced by Pseudomonas aeruginosa bacteria, playing roles in quorum sensing and virulence (27–29). We further mapped shotgun metagenomics data collected on samples with PQS present against PQS BGC, and we identified 2,472 out of 2,488,704 reads mapped to PQS BGC.
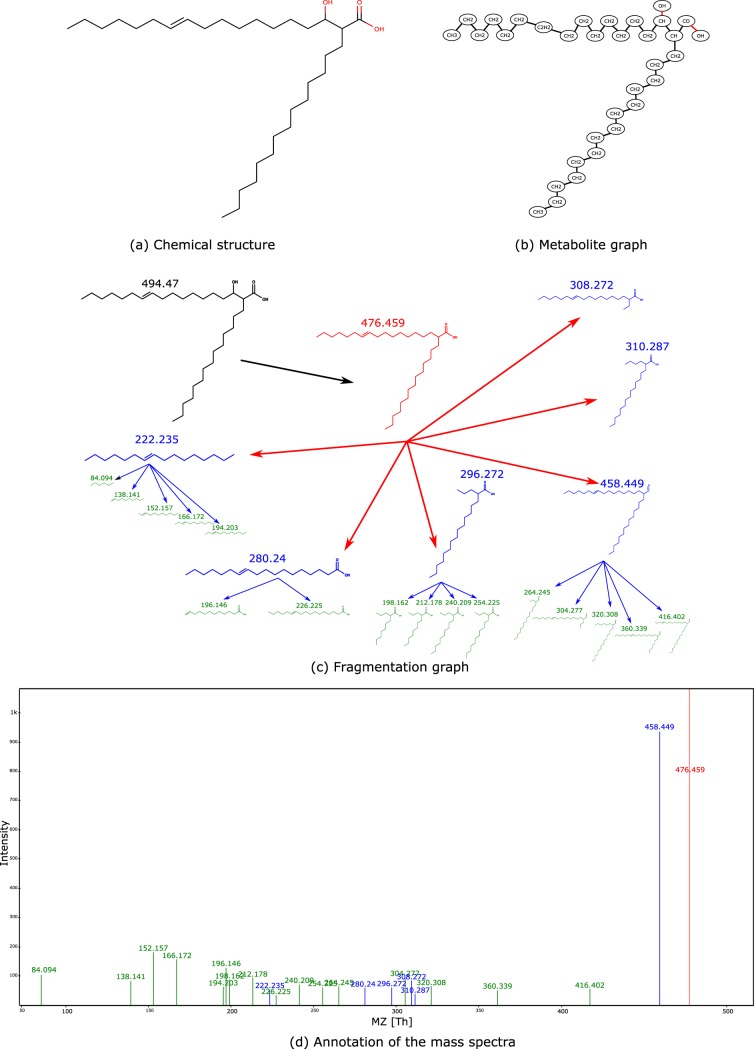
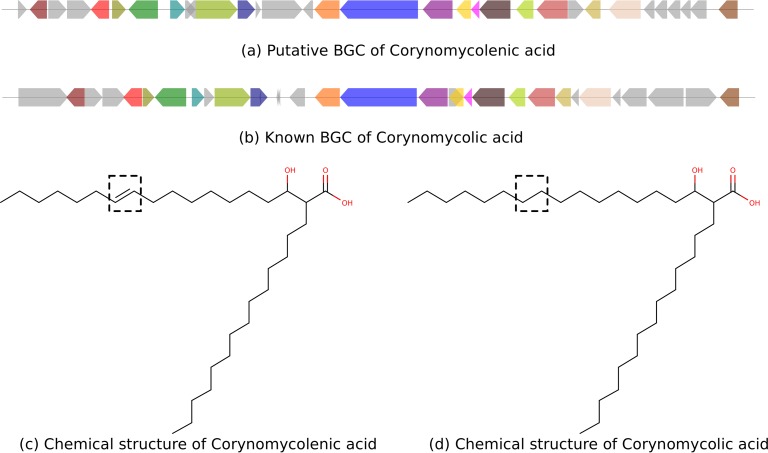
A Corynebacterium kutscheri OTU feature (Greengenes number 13393) is positively correlated with a molecule at m/z 495.4 (P = 3 · 10−5). Dereplicator+ annotated this molecule as corynomycolenic acid (Fig. 4). The BGC for corynomycolic acid, which is a close variant of corynomycolenic acid, has previously been discovered in Corynebacterium diphtheria strain NCTC 13129 (30). The reference genome with a feature closest to this C. kutscheri feature is that of C. kutscheri strain DSM 20755 (31) (99% identical 16S rRNA over 100% coverage), which contains a BGC with high similarity to the corynomycolic acid BGC reported in C. diphtheriae NCTC 13129 (72% identical over 52% coverage).
FIG 4.
(a) Chemical structure of corynomycolenic acid. (b) Metabolite graph of corynomycolenic acid. (c) Fragmentation graph of corynomycolenic acid. (d) Annotation of the mass spectra of corynomycolenic acid (only explained peaks are shown).
We also observed a positive correlation between Desulfovibrio species and cholic acid (P = 10−13), which is a human bile acid (Fig. 3c). This is explained by the fact that the Desulfovibrio species feed on the sulfur released by deconjugation of taurocholic acids to cholic acid (32). As sulfur is below the dynamic range of mass spectrometers, the association network fails to correlate sulfur with Desulfovibrio species. This example shows that some of the detected associations are noncausal.
We observed significant positive correlations between stercobilin (m/z 595.35 [P = 6 · 10−29]), and some of the Clostridiales. It is well known that stercobilin and urobilin are the end products of heme catabolism by Clostridiales through bilirubin glucuronidase and bilirubin reductase enzymes (33, 34). Clostridiales also showed negative correlations with dehydrobilirubin (m/z 587.3 [P = 10−30]) and urobilin (m/z 591.35 [P = 5 · 10−26]), which are the products of bilirubin reductase.
Several species within the Enterobacteriaceae showed a negative correlation with cholic acid (m/z 409.29 [P = 2e−26]) and a positive correlation with 7-oxodeoxycholate (m/z 407.28 [P = 4e−10]), confirming the evidence that Enterobacteriaceae play a role in dehydrogenation of bile acids (35, 36).
We also observed a strong correlation between Bacillus species and a steroid hormone with m/z 285.18 (P = 9 · 10−24). Bacillus species are known to biotransform steroids (37).
In addition, we observed a negative correlation between Oxalobacteraceae and phenylalanine (m/z 165.08 [P = 6 · 10−11]) and n-acetylphenylalanine (m/z 207.12 [P = 3 · 10−13]). In fact, phenylalanine and n-acetylphenylalanine were not detectable in any of the subjects where Oxalobacteraceae were present. Oxalobacteraceae species are shown to be capable of consuming phenylalanine as a carbon source (38).
Clostridiales species showed negative correlations with phenylalanine (m/z 165.08 [P = 2 · 10−15]), tryptophan (m/z 206.07 [P = 10−27]), dihydroxyphenylacetic acid (m/z 153.056 [P = 3 · 10−11]), and tyrosine (m/z 182.08 [P = 5 · 10−13]) and a positive correlation with indolepropionate (m/z 190.018 [P = 8 · 10−11]). Clostridiales is known to biotransform the phenyl residue in these molecules (39).
Correlating mass spectral data to BGC families.
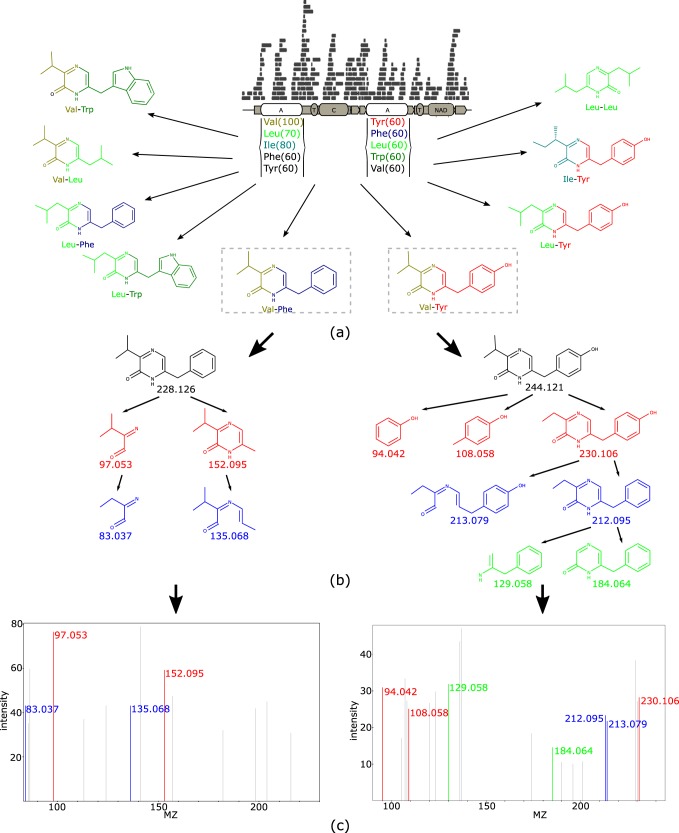
In the HUMAN-CF data set, we correlated BGC families with molecular features and discovered an interesting BGC family containing two adenylation domains, two thiolation domains, one condensation domain, and one NAD binding domain (Fig. 5a) that was positively correlated with two molecular features (m/z 229.135 [P = 4.05 · 10−16] and m/z 245.125 [P = 1.98 · 10−9]). Dereplicator+ annotated these two features as phevalin (score of 4) and tyrvalin (score of 7). These annotations matched the adenylation specificities of the corresponding domains (Fig. 5). BLAST results suggest that this BGC family contains the aureusimine nonribosomal peptide synthetase from Staphylococcus aureus (100% coverage and 99.46% identity), which is known for the synthesis of phevalin and tyrvalin (40). 16S rRNA sequencing results show that Staphylococcus aureus is widely present in the HUMAN-CF data set (17).
FIG 5.
BGC of phevalin. (a) Putative nonribosomal peptide synthetase (NRP) BGC discovered by antiSMASH. This BGC contains two adenylation domains (A), two thiolation domains (T), one condensation domain (C), and one NAD binding domain (NAD). Under each adenylation domain are the associated amino acids and scores predicted by NRPSPredictor. The greater the score, the greater the likelihood that the amino acid will be recognized by the adenylation domain. The surrounding structures are the putative molecules that can be produced by the BGC. (b) Fragmentation tree of Val-Phe (phevalin) and Val-Tyr (tyrvalin) given by Dereplicator+. (c) Mass spectral annotations given by Dereplicator+.
Discovering a corynomycolenic acid BGC.
We further investigated the genes responsible for the production of corynomycolenic acid in the human microbiota. Corynomycolenic acid is a member of the mycolic acid family with immunomodulatory activities that is produced by Corynebacterium and Mycobacterium species (41–44). These molecules are ligands of human T cells, prompting specific immune responses. Mining the genome of C. kutscheri DSM 20755 revealed a BGC that contains all the necessary biosynthetic enzymes for the production of corynomycolenic acid (Table 1, Fig. 6). Moreover, we highlight the different genes of the two BGCs which are potentially responsible for the structural difference between the molecules from the two species (Table 2).
TABLE 1.
Shared genes of the corynomycolic acid BGC from Corynebacterium diphtheria NCTC 13129 and the putative corynomycolenic acid BGC from Corynebacterium kutscheri DSM 20755a
| Shared gene in BGC from: |
COG |
Protein functionb |
|||||||
|---|---|---|---|---|---|---|---|---|---|
|
C. diphtheria NCTC 13129 |
C. kutscheri DSM 20755 |
||||||||
| Position |
Strand |
Geneb |
Position |
Strand |
Geneb |
||||
| Start | End | Start | End | ||||||
| 4169 | 3030 | − | 1837 | 776 | − | COG1835 | Acyltransferase | ||
| 7716 | 6562 | − | pimB [H] | 5690 | 4560 | − | rfaB [C] | COG0438 | Mannosyltransferase/glycosyltransferase |
| 7758 | 8492 | + | ubiE [C] | 5875 | 6735 | + | COG0500 | Methyltransferase | |
| 10460 | 8517 | − | pckG [H] | 8719 | 6896 | − | pckG [H] | COG1274 | Phosphoenolpyruvate carboxykinase |
| 10812 | 11591 | + | trmB | 9478 | 10401 | + | trmB [H] | COG0220 | tRNA methyltransferase |
| 12223 | 14463 | + | mmpL3 [H] | 11071 | 13662 | + | mmpL3 [H] | COG2409 | Putative membrane protein |
| 14450 | 15508 | + | 13666 | 14745 | + | COG0392 | Membrane protein | ||
| 19989 | 18439 | − | pccB [H] | 19980 | 18418 | − | accD5 [H] | Propionyl-CoA carboxylase beta chain | |
| 24761 | 20001 | − | ppsA [H] | 24845 | 20001 | − | ppsA [H] | COG3321 | Polyketide synthase |
| 26674 | 24860 | − | fadD32 [H] | 26987 | 25143 | − | fadD32 [H] | COG0318 | Long-chain fatty acid–AMP ligase |
| 27660 | 26749 | − | 28128 | 27214 | − | Cutinase | |||
| 28181 | 27666 | − | 28649 | 28134 | − | Hypothetical protein DIP | |||
| 30205 | 28181 | − | csp1 [H] | 30577 | 28646 | − | csp1 [H] | COG0627 | Protein PS1 [H] |
| 31486 | 30458 | − | csp1 [H] | 32001 | 30934 | − | fbpC [H] | COG0627 | Protein PS1 [H]/antigen 85-C [H] |
| 33329 | 31641 | − | 34132 | 32198 | − | Transmembrane protein | |||
| 34315 | 33338 | − | 36163 | 35192 | − | COG0382 | Protein y4nM [H] | ||
| 36791 | 34806 | − | glfT2 [H] | 38653 | 36674 | − | glfT2 [H] | UDP-galactofuranosyl transferase | |
| 44742 | 43552 | − | rfbD [H] | 44664 | 43483 | − | rfbD [H] | COG0562 | UDP-galactopyranose mutase |
The genes were annotated by using BASys (45).
Results given by similarity search in BASys are indicated as follows: [H], homology to a SwissProt entry; [C], homology to a CCDB entry.
FIG 6.
(a) Putative BGC of corynomycolenic acid in Corynebacterium kuscheri strain DSM 20755. (b) Known BGC of corynomycolic acid in Corynebacterium diphtheria strain NCTC 13129. Genes annotated with the same function in the two BGCs are in the same color. Genes in gray are unique genes of the two BGCs. (c) Chemical structure of corynomycolenic acid. (d) Chemical structure of corynomycolic acid. The structural difference between the two molecules is highlighted in black boxes.
TABLE 2.
Unique genes of the corynomycolic acid BGC from Corynebacterium diphtheria NCTC 13129 and the putative corynomycolenic acid BGC from Corynebacterium kutscheri DSM 20755a
| Source of BGC | Gene position |
Strand | Geneb | COG | Function | |
|---|---|---|---|---|---|---|
| Start | End | |||||
| C. diphtheria NCTC 13129 | 61 | 3138 | + | Coagulation factor 5/8-type domain-containing protein | ||
| 4176 | 5276 | + | Hypothetical protein Cauri | |||
| 5267 | 6679 | + | Integral membrane protein | |||
| 11576 | 12208 | + | Hypothetical protein | |||
| 15103 | 15002 | − | Hypothetical protein | |||
| 16160 | 16059 | − | Hypothetical protein | |||
| 16147 | 16251 | + | Hypothetical protein | |||
| 16296 | 16153 | − | Hypothetical protein | |||
| 17827 | 16859 | − | Cell wall surface anchor family protein | |||
| 26737 | 27669 | + | Hypothetical protein | |||
| 34806 | 34312 | − | COG0671 | Membrane-associated phospholipid phosphatase | ||
| 37391 | 36876 | − | ybjG [C] | COG0671 | PAP2 superfamily protein | |
| 39009 | 37432 | − | gbsA [H] | COG1012 | Betaine aldehyde dehydrogenase | |
| 41301 | 39076 | − | betT [H] | COG1292 | High-affinity choline transport protein | |
| 41438 | 43366 | + | betA [H] | COG2303 | Choline dehydrogenase | |
| C. kutscheri DSM 20755 | 41 | 601 | + | Hypothetical CgR protein | ||
| 1923 | 3059 | + | Hypothetical protein A | |||
| 3084 | 4592 | + | Hypothetical protein A | |||
| 10402 | 11067 | + | Hypothetical | |||
| 11081 | 10443 | − | Hypothetical protein | |||
| 14777 | 15109 | + | Hypothetical protein Cauri | |||
| 15170 | 17683 | + | pepN [H] | COG0308 | Aminopeptidase N | |
| 18337 | 17705 | − | pcp [H] | COG2039 | Pyrrolidone-carboxylate peptidase | |
| 34155 | 35132 | + | Hypothetical Protein | |||
| 39510 | 38839 | − | ideR [H] | COG1321 | Iron-dependent repressor | |
| 40294 | 39497 | − | znuB [C] | COG1108 | 29-kDa membrane protein in fimA 5′ region | |
| 41112 | 40291 | − | yfeC [H] | COG1108 | Chelated iron transport system membrane protein | |
| 41752 | 41099 | − | mntB [H] | COG1121 | Manganese transport system ATP-binding protein | |
| 42741 | 41713 | − | mntA [H] | COG0803 | Manganese-binding lipoprotein | |
The genes were annotated by using BASys (45).
Results given by similarity search in BASys are indicated as follows: [H], homology to a SwissProt entry; [C], homology to a CCDB entry.
Assigning molecular features to the corresponding phylogenetic clades.
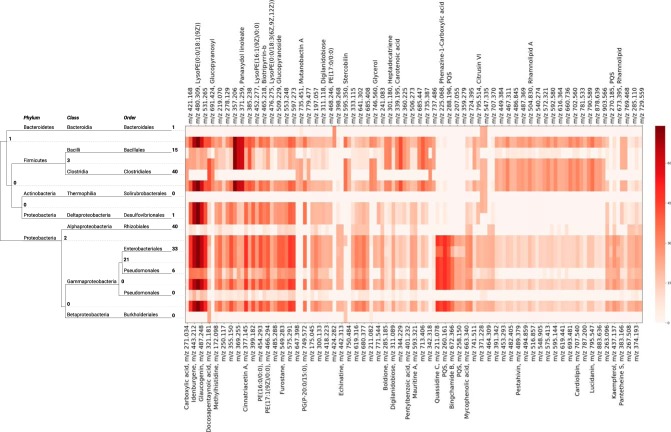
We assigned the molecular features to the clades in the phylogenetic tree with which they were significantly associated. For this analysis, we used the Greengenes phylogenetic tree, which was pruned to keep only the OTUs that were associated with at least one metabolite. At a P value threshold of 10−10, 550 of the MS-Clustering features were mapped to 872 OTUs in the phylogenetic tree. Figure 7 demonstrates molecular features assigned to different clades at a P value threshold of 10−20.
FIG 7.
Assigning the molecular features that are positively associated with the microbial features at a P value threshold of 10−20 to the phylogenetic tree. The tree is trimmed to the taxonomic-order level. Numbers in boldface show the counts of molecules assigned to the corresponding clades. Heatmap shows −log10(P), where P is the minimal P value between the molecule and an OTU within the clade. Dereplicator+ molecular annotations for the known molecules are shown. The molecular features were extracted by MSClustering based on tandem mass spectral data and annotated by spectral library search and Dereplicator+ (level 2 and 4 metabolite identification) (46).
Benchmarking.
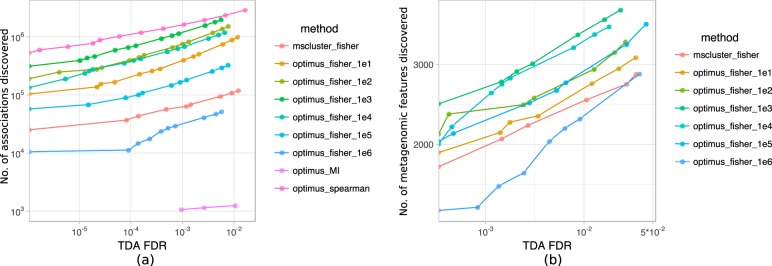
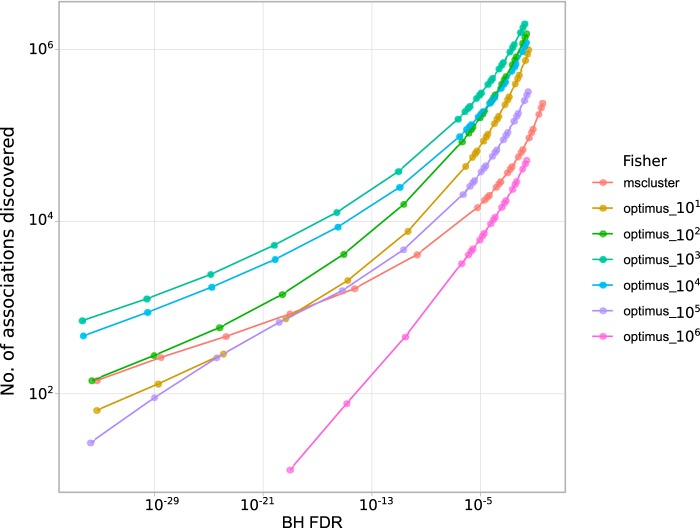
We benchmarked various feature extraction methods with various parameters by comparing the numbers of identifications at different false discovery rates. Moreover, we benchmarked four different techniques for estimating the associations between molecular and microbial features. These techniques include Fisher’s exact test (for binary data), Pearson’s correlation test, Spearman’s correlation test, and the mutual information criterion. Our results show that Optimus and Spearman’s correlation are the best feature extraction and association methods (Fig. 8 and 9).
FIG 8.
Benchmarking various feature extraction methods and association tests. Different methods are compared based on the number of associations discovered (a) and the number of unique metagenomic features associated with a molecular feature (b) at different false discovery rate thresholds. Here, we benchmark MS-Clustering and Optimus (binarized abundance with thresholds 10, 102, …, 106) with Fisher’s exact test association and Optimus (continuous abundance) with Pearson’s correlation test association, Spearman’s rank correlation test association, and mutual information criterion. In the case of Pearson’s correlation, no association was discovered at a false discovery rate of 0.01.
FIG 9.
Benchmarking MS-Clustering and Optimus (binarized abundance with thresholds 10, 102, …, 106) with Fisher’s exact test association. Data on the x axis represent false discovery rates estimated by the Benjamini-Hochberg procedure. Data on the y axis represent the numbers of metabolite-microbe associations discovered.
DISCUSSION
Recent experimental advances have enabled the acquisition of tandem mass spectrometry and shotgun metagenomics data from tens of thousands of environmental/host-oriented microbial communities through large-scale projects, including the American Gut Project and the Integrative Human Microbiome Project. Metagenome-mining studies have revealed thousands of biosynthetic enzymes with uncharacterized substrates/products from these data sets. Moreover, metabolomics studies have revealed signals for hundreds of thousands of bioactive small molecules in the mass spectral data sets.
While these data sets represent a gold mine for discovering small molecules associated with the microbiota, manual analysis of billions of mass spectra in these data sets is infeasible, and new computational approaches are needed to integrate the large-scale metagenomics and tandem mass spectrometry data for systematic discovery of the unknown small-molecule products of the biosynthetic enzymes. In this regard, the following three questions need to be addressed. (i) Is the molecular feature associated with the microbiota? If so, which microbial species is it associated with? (ii) Which biosynthetic enzyme within the microbial species is it associated with? (iii) What is the chemical structure of the molecule?
In this article, we developed a method for addressing the first question. Our method detects microbial natural products and microbial biotransformation products through a comparative analysis of the molecular and microbial features across multiple microbiomes. In the case of corynomycolenic acid, we further used genome mining to assign the molecule to its BGC within the genome of its microbial producer. While identification of the biosynthetic enzymes responsible for corynomycolenic acid production provides a proof of concept, novel computational methods are needed for systematic characterization of the products of the microbial biosynthetic enzymes through the association network approach.
The association network detects pairwise interactions between the molecular and microbial features across thousands of microbiomes. While this method is capable of discovering microbial natural products and microbial biotransformation products, interactions that involve multiple sequential biotransformations/complex pathways cannot be handled. Moreover, many of the interactions retrieved by this method are noncausal correlations. For example, the association network finds correlating features that are caused by a confounding factor. While this results in a denser network with noncausal edges, in some scenarios, these noncausal edges can lead to the discovery of causal interactions that were missed by the network.
Currently, the association network approach is based on the use of Fisher’s exact test P values, which assumes different samples are independent. While the independence assumption is natural for data sets such as that of the American Gut Project, collected from distinct individuals, confounders like health status could increase the false discovery rate. The association network approach is the first step toward detecting the complex interactions between microbial and molecular features through the comparative analysis of thousands of microbiome samples.
In addition to linking BGCs to molecules, other potential applications of association networks include detection of carbon sources depleted by microorganisms, identifying biomarkers for drug metabolism, linking microbial enzymes to xenobiotic metabolism, and identifying the role of microbial metabolites in disease. Association networks provide an untargeted approach for generating/testing various hypotheses about the causal relationships between the molecules and microbes in complex communities.
MATERIALS AND METHODS
Definitions.
Consider a set of microbial community samples (Samples), a set of molecular features (Molecules), and a set of microbial features (Microbes). Here, each molecular feature is the abundance of a specific molecule (binary or continuous), and each microbial feature is the abundance of a specific microbe. Every feature X is characterized by a subset of samples that X is present in, as follows: SamplesX={S∈Samples|X is present in S}. Here, S represents a sample.
Inputs.
The inputs to our pipeline are the untargeted mass spectrometry data and metagenomics data collected on a set of microbiome samples.
Main pipeline.
The association network pipeline consists of the following steps.
(i) For microbial feature extraction, QIIME (47) is used to extract and quantify the operational taxonomic units (OTUs) from the 16S rRNA sequencing data. The QIIME output is the OTUCount matrix, where OTUCount(A, S) is the number of times an OTU A is observed in a sample S. For each OTU A, we define SamplesA={S|OTUCount(A,S)>MinCount} for a threshold MinCount.
When shotgun metagenomics data are available, we can quantify BGC families on top of OTUs. First, we apply SPAdes (18) to metagenomics data to obtain genome assemblies. Second, we apply antiSMASH (19) to the genome assemblies to extract putative BGCs. Third, we use BiG-SCAPE (20) to cluster similar BGCs into BGC families, resulting in an absence-presence table of the BGC families in each sample. We exclude from analysis rare BGC families that are present in less than 10 samples.
(ii) For molecular feature extraction, molecular features from the liquid chromatography-mass spectrometry (LC-MS) data are first extracted and quantified using the feature extraction algorithm Optimus (48). Optimus outputs the FeatureIntensity matrix, where FeatureIntensity(X, S) is the intensity of a feature X in a sample S. We then select a threshold MinIntensity, and for every feature X, we define SamplesX={S|FeatureIntensity(X,S)>MinIntensity}. We further remove molecular features that are present in less than two samples. When LC-MS/MS data are available, we extract molecular features using the MS-Clustering algorithm (49). Since the LC-MS/MS data are more suitable for molecular-feature annotation, we use MS-Clustering as the molecular-feature extraction method when analyzing the AGP and HUMAN-CF data sets.
We also construct a set of decoy molecular features, DecoyMolecules (Fig. 1b). These decoy molecules are used to estimate the FDR. The set DecoyMolecules is created as follows: for every feature X∈Molecules, we construct a decoy feature Xd, with SamplesXd being a randomly chosen subset of Samples with size |SamplesX|.
(iii) To perform the association test, we then search for pairwise associations between Molecules and Microbes (Fig. 1c). More specifically, we look for pairs (X, A) consisting of a molecular feature X and a microbial feature A that have a statistically significant correlation in their patterns of occurrence.
Given two features X and A, to detect whether X and A are cooccurring, we consider the null hypothesis that the events “X is present in a sample” and “A is present in a sample” are independent. A statistically significant correlation in the patterns of occurrence of X and A is detected if the P value of Fisher’s exact test, denoted PValue(X, Y), is lower than the selected threshold PThreshold, and the null hypothesis is rejected.
While there are other techniques for computing the associations between the molecular and microbial features, including Pearson’s correlation, Spearman’s correlation, and mutual information criterion, in this section, we focus on the Fisher’s exact test method.
For the multiple-hypothesis testing, we compute the FDR using the target-decoy approach (TDA) (50). We first search for the associations between DecoyMolecules and Microbes and then estimate the FDR as |DecoyAssociations| / |RealAssociations|, where DecoyAssociations and RealAssociations are the sets of association pairs found in decoy and target data sets. We also use the Benjamini-Hochberg (BH) procedure for estimating the FDR.
(iv) To build the associations network, we further construct a bipartite network where the vertices are the molecular and microbial features and there is an edge between two vertices if the corresponding features are associated (Fig. 1d).
(v) We also report the associations between the molecular features and the groups of related microbial features by assigning molecular features to the clades in the phylogenetic tree that are potentially responsible for their production/biotransformation (Fig. 1e). Note that here, assignment of a molecule to a phylogenetic clade does not necessarily mean that the molecule is produced by those species. For example, those species might play a role in biotransformation of the molecule.
Given a phylogenetic tree T and a molecular feature X, we first mark all the microbial features that are positively correlated to X and count the number of marked features in every clade. Then, we select the minimal clade that has at least P percent (P = 80) of features marked. If the selected clade is a proper subset of the whole tree, we assign X to this clade. We perform the steps described for every molecular feature, and for each clade, we report the set of molecular features that are assigned to it.
Deduplication of molecular features.
Feature extraction methods usually report redundant features, i.e., each single molecule is reported as multiple features with similar m/z values. Such features are called “duplicates.” The process of finding all groups of duplicate features and merging them into unique features is called “deduplication.” We apply deduplication to remove the redundancy in the molecular features.
We consider a pair of molecular features to be duplicates if they have similar m/z values and a statistically significant correlation in their patterns of occurrence. Then, we build a graph in which molecular features are nodes and every putative pair of duplicates is connected by an edge. The connected components of the resulting graph are the groups of duplicate features. For the i-th group DuplicatesGroupi, a new consensus feature Yi is constructed with the m/z being the average m/z of all the features in DuplicatesGroupi, and SamplesYi is defined as the union
Benchmarking.
Molecular-feature extraction consists of identification and quantification of the peaks across multiple LC-MS runs and is a fundamental step in proteomics and metabolomics. Although many tools for molecular-feature extraction have been proposed, it is not clear which one is more accurate. Moreover, it is not clear how to adjust the parameters in various feature extraction methods.
Here, we describe an approach to compare the various feature extraction methods in the microbiome-wide correlation studies. Given a set of microbial features and several feature extraction methods with various sets of molecular features, we apply the pairwise association pipeline to these sets to identify the method and the parameter settings that result in the highest number of pairs of cooccurring features discovered at a certain FDR level. To avoid bias toward methods that report higher numbers of molecular features, we also compare the numbers of discovered microbial features in these pairs. The FDR is estimated by the target-decoy approach (TDA) and the Benjamini-Hochberg procedure. Four different association tests are benchmarked, including Fisher’s exact test, Pearson’s correlation test, Spearman’s rank correlation test, and the mutual information criterion.
Data availability.
The association networks computer code is available on GitHub at https://github.com/mohimanilab/AssociationNetworks.
ACKNOWLEDGMENTS
The work of L.C., E.S., and H.M. was supported by a start-up package from Carnegie Mellon University and a fellowship from the Alfred P. Sloan Foundation. The work of L.C. and H.M. was also supported by National Institutes of Health New Innovator Award DP2GM137413.
REFERENCES
- 1.Gilbert JA, Quinn RA, Debelius J, Xu ZZ, Morton J, Garg N, Jansson JK, Dorrestein PC, Knight R. 2016. Microbiome-wide association studies link dynamic microbial consortia to disease. Nature 535:94–103. doi: 10.1038/nature18850. [DOI] [PubMed] [Google Scholar]
- 2.Wang J, Jia H. 2016. Metagenome-wide association studies: fine-mining the microbiome. Nat Rev Microbiol 14:508–522. doi: 10.1038/nrmicro.2016.83. [DOI] [PubMed] [Google Scholar]
- 3.Zhang LS, Davies SS. 2016. Microbial metabolism of dietary components to bioactive metabolites: opportunities for new therapeutic interventions. Genome Med 8:46. doi: 10.1186/s13073-016-0296-x. [DOI] [PMC free article] [PubMed] [Google Scholar]
- 4.Koppel N, Rekdal VM, Balskus EP. 2017. Chemical transformation of xenobiotics by the human gut microbiota. Science 356:eaag2770. doi: 10.1126/science.aag2770. [DOI] [PMC free article] [PubMed] [Google Scholar]
- 5.Boursier J, Rawls JF, Diehl AM. 2013. Obese humans with nonalcoholic fatty liver disease display alterations in fecal microbiota and volatile organic compounds. Clin Gastroenterol Hepatol 11:876–878. doi: 10.1016/j.cgh.2013.04.016. [DOI] [PubMed] [Google Scholar]
- 6.Jansson J, Willing B, Lucio M, Fekete A, Dicksved J, Halfvarson J, Tysk C, Schmitt-Kopplin P. 2009. Metabolomics reveals metabolic biomarkers of Crohn’s disease. PLoS One 4:e6386. doi: 10.1371/journal.pone.0006386. [DOI] [PMC free article] [PubMed] [Google Scholar]
- 7.Chankhamjon P, Javdan B, Lopez J, Hull R, Chatterjee S, Donia MS. 2019. Systematic mapping of drug metabolism by the human gut microbiome. bioRxiv https://www.biorxiv.org/content/early/2019/02/03/538215. [DOI] [PMC free article] [PubMed]
- 8.iHMP Research Network Consortium. 2014. The Integrative Human Microbiome Project: dynamic analysis of microbiome-host omics profiles during periods of human health and disease. Cell Host Microbe 16:276–289. doi: 10.1016/j.chom.2014.08.014. [DOI] [PMC free article] [PubMed] [Google Scholar]
- 9.McDonald D, Hyde E, Debelius JW, Morton JT, Gonzalez A, Ackermann G, Aksenov AA, Behsaz B, Brennan C, Chen Y, DeRight Goldasich L, Dorrestein PC, Dunn RR, Fahimipour AK, Gaffney J, Gilbert JA, Gogul G, Green JL, Hugenholtz P, Humphrey G, Huttenhower C, Jackson MA, Janssen S, Jeste DV, Jiang L, Kelley ST, Knights D, Kosciolek T, Ladau J, Leach J, Marotz C, Meleshko D, Melnik AV, Metcalf JL, Mohimani H, Montassier E, Navas-Molina J, Nguyen TT, Peddada S, Pevzner P, Pollard KS, Rahnavard G, Robbins-Pianka A, Sangwan N, Shorenstein J, Smarr L, Song SJ, Spector T, Swafford AD, Thackray VG, et al. . 2018. American Gut: an open platform for citizen science microbiome research. mSystems 3:e00031-18. doi: 10.1128/mSystems.00031-18. [DOI] [PMC free article] [PubMed] [Google Scholar]
- 10.Knight R, Vrbanac A, Taylor BC, Aksenov A, Callewaert C, Debelius J, Gonzalez A, Kosciolek T, McCall LI, McDonald D, Melnik AV, Morton JT, Navas J, Quinn RA, Sanders JG, Swafford AD, Thompson LR, Tripathi A, Xu ZZ, Zaneveld JR, Zhu Q, Caporaso JG, Dorrestein PC. 2018. Best practices for analysing microbiomes. Nat Rev Microbiol 16:410–422. doi: 10.1038/s41579-018-0029-9. [DOI] [PubMed] [Google Scholar]
- 11.Schrimpe-Rutledge AC, Codreanu SG, Sherrod SD, McLean JA. 2016. Untargeted metabolomics strategies—challenges and emerging directions. J Am Soc Mass Spectrom 27:1897–1905. doi: 10.1007/s13361-016-1469-y. [DOI] [PMC free article] [PubMed] [Google Scholar]
- 12.Melnik AV, da Silva RR, Hyde ER, Aksenov AA, Vargas F, Bouslimani A, Protsyuk I, Jarmusch AK, Tripathi A, Alexandrov T, Knight R, Dorrestein PC. 2017. Coupling targeted and untargeted mass spectrometry for metabolome-microbiome-wide association studies of human fecal samples. Anal Chem 89:7549–7559. doi: 10.1021/acs.analchem.7b01381. [DOI] [PubMed] [Google Scholar]
- 13.Bouslimani A, Porto C, Rath CM, Wang M, Guo Y, Gonzalez A, Berg-Lyon D, Ackermann G, Moeller Christensen GJ, Nakatsuji T, Zhang L, Borkowski AW, Meehan MJ, Dorrestein K, Gallo RL, Bandeira N, Knight R, Alexandrov T, Dorrestein PC. 2015. Molecular cartography of the human skin surface in 3D. Proc Natl Acad Sci U S A 112:E2120–E2129. doi: 10.1073/pnas.1424409112. [DOI] [PMC free article] [PubMed] [Google Scholar]
- 14.Wang M, Carver JJ, Phelan VV, Sanchez LM, Garg N, Peng Y, Nguyen DD, Watrous J, Kapono CA, Luzzatto-Knaan T, Porto C, Bouslimani A, Melnik AV, Meehan MJ, Liu W-T, Crüsemann M, Boudreau PD, Esquenazi E, Sandoval-Calderón M, Kersten RD, Pace LA, Quinn RA, Duncan KR, Hsu C-C, Floros DJ, Gavilan RG, Kleigrewe K, Northen T, Dutton RJ, Parrot D, Carlson EE, Aigle B, Michelsen CF, Jelsbak L, Sohlenkamp C, Pevzner P, Edlund A, McLean J, Piel J, Murphy BT, Gerwick L, Liaw C-C, Yang Y-L, Humpf H-U, Maansson M, Keyzers RA, Sims AC, Johnson AR, Sidebottom AM, Sedio BE, Klitgaard A, Larson CB, et al. . 2016. Sharing and community curation of mass spectrometry data with GNPS. Nat Biotechnol 34:828–837. doi: 10.1038/nbt.3597. [DOI] [PMC free article] [PubMed] [Google Scholar]
- 15.Mohimani H, Gurevich A, Shlemov A, Mikheenko A, Korobeynikov A, Cao L, Shcherbin E, Nothias LF, Dorrestein PC, Pevzner PA. 2018. Dereplication of microbial metabolites through database search of mass spectra. Nat Commun 9:4035. doi: 10.1038/s41467-018-06082-8. [DOI] [PMC free article] [PubMed] [Google Scholar]
- 16.McDonald D, Price MN, Goodrich J, Nawrocki EP, DeSantis TZ, Probst A, Andersen GL, Knight R, Hugenholtz P. 2012. An improved Greengenes taxonomy with explicit ranks for ecological and evolutionary analyses of bacteria and archaea. ISME J 6:610–618. doi: 10.1038/ismej.2011.139. [DOI] [PMC free article] [PubMed] [Google Scholar]
- 17.Quinn RA, Whiteson K, Lim YW, Zhao J, Conrad D, LiPuma JJ, Rohwer F, Widder S. 2016. Ecological networking of cystic fibrosis lung infections. NPJ Biofilms Microbiomes 2:4. doi: 10.1038/s41522-016-0002-1. [DOI] [PMC free article] [PubMed] [Google Scholar]
- 18.Bankevich A, Nurk S, Antipov D, Gurevich AA, Dvorkin M, Kulikov AS, Lesin VM, Nikolenko SI, Pham S, Prjibelski AD, Pyshkin AV, Sirotkin AV, Vyahhi N, Tesler G, Alekseyev MA, Pevzner PA. 2012. SPAdes: a new genome assembly algorithm and its applications to single-cell sequencing. J Comput Biol 19:455–477. doi: 10.1089/cmb.2012.0021. [DOI] [PMC free article] [PubMed] [Google Scholar]
- 19.Weber T, Blin K, Duddela S, Krug D, Kim HU, Bruccoleri R, Lee SY, Fischbach MA, Müller R, Wohlleben W, Breitling R, Takano E, Medema MH. 2015. antiSMASH 3.0—a comprehensive resource for the genome mining of biosynthetic gene clusters. Nucleic Acids Res 43:W237–W243. doi: 10.1093/nar/gkv437. [DOI] [PMC free article] [PubMed] [Google Scholar]
- 20.Navarro-Muñoz JC, Selem-Mojica N, Mullowney MW, Kautsar S, Tryon JH, Parkinson EI, De Los Santos ELC, Yeong M, Cruz-Morales P, Abubucker S, Roeters A, Lokhorst W, Fernandez-Guerra A, Dias Cappelini LT, Thomson RJ, Metcalf WW, Kelleher NL, Barona-Gomez F, Medema MH. 2018. A computational framework for systematic exploration of biosynthetic diversity from large-scale genomic data. bioRxiv https://www.biorxiv.org/content/early/2018/10/17/445270. [DOI] [PMC free article] [PubMed]
- 21.Blunt JW, Munro MHG, Laatsch H. 2011. AntiMarin database. University of Canterbury, Christchurch, New Zealand; University of Gottingen, Gottingen, Germany.
- 22.Dictionary of Natural Products database, version 19.1. CRC Press, Boca Raton, FL. http://dnp.chemnetbase.com/.
- 23.Wishart DS, Feunang YD, Marcu A, Guo AC, Liang K, Vazquez-Fresno R, Sajed T, Johnson D, Li C, Karu N, Sayeeda Z, Lo E, Assempour N, Berjanskii M, Singhal S, Arndt D, Liang Y, Badran H, Grant J, Serra-Cayuela A, Liu Y, Mandal R, Neveu V, Pon A, Knox C, Wilson M, Manach C, Scalbert A. 2018. HMDB 4.0: the human metabolome database for 2018. Nucleic Acids Res 46:D608–D617. doi: 10.1093/nar/gkx1089. [DOI] [PMC free article] [PubMed] [Google Scholar]
- 24.Abdel-Mawgoud AM, Lépine F, Déziel E. 2010. Rhamnolipids: diversity of structures, microbial origins and roles. Appl Microbiol Biotechnol 86:1323–1336. doi: 10.1007/s00253-010-2498-2. [DOI] [PMC free article] [PubMed] [Google Scholar]
- 25.Watrous J, Roach P, Alexandrov T, Heath BS, Yang JY, Kersten RD, van der Voort M, Pogliano K, Gross H, Raaijmakers JM, Moore BS, Laskin J, Bandeira N, Dorrestein PC. 2012. Mass spectral molecular networking of living microbial colonies. Proc Natl Acad Sci U S A 109:E1743–E1752. doi: 10.1073/pnas.1203689109. [DOI] [PMC free article] [PubMed] [Google Scholar]
- 26.Lépine F, Milot S, Déziel E, He J, Rahme LG. 2004. Electrospray/mass spectrometric identification and analysis of 4-hydroxy-2-alkylquinolines (HAQs) produced by Pseudomonas aeruginosa. J Am Soc Mass Spectrom 15:862–869. doi: 10.1016/j.jasms.2004.02.012. [DOI] [PubMed] [Google Scholar]
- 27.Thomashow LS, Weller DM, Bonsall RF, Pierson LS. 1990. Production of the antibiotic phenazine-1-carboxylic acid by fluorescent Pseudomonas species in the rhizosphere of wheat. Appl Environ Microbiol 56:908–912. [DOI] [PMC free article] [PubMed] [Google Scholar]
- 28.Ochsner UA, Reiser J, Fiechter A, Witholt B. 1995. Production of Pseudomonas aeruginosa rhamnolipid biosurfactants in heterologous hosts. Appl Environ Microbiol 61:3503–3506. [DOI] [PMC free article] [PubMed] [Google Scholar]
- 29.Gallagher LA, McKnight SL, Kuznetsova MS, Pesci EC, Manoil C. 2002. Functions required for extracellular quinolone signaling by Pseudomonas aeruginosa. J Bacteriol 184:6472–6480. doi: 10.1128/JB.184.23.6472-6480.2002. [DOI] [PMC free article] [PubMed] [Google Scholar]
- 30.Ott L, Hacker E, Kunert T, Karrington I, Etschel P, Lang R, Wiesmann V, Wittenberg T, Singh A, Varela C, Bhatt A, Sangal V, Burkovski A. 2017. Analysis of Corynebacterium diphtheriae macrophage interaction: dispensability of corynomycolic acids for inhibition of phagolysosome maturation and identification of a new gene involved in synthesis of the corynomycolic acid layer. PLoS One 12:e0180105. doi: 10.1371/journal.pone.0180105. [DOI] [PMC free article] [PubMed] [Google Scholar]
- 31.Rückert C, Albersmeier A, Winkler A, Tauch A. 2015. Complete genome sequence of Corynebacterium kutscheri DSM 20755, a corynebacterial type strain with remarkably low G+C content of chromosomal DNA. Genome Announc 3:e00571-15. doi: 10.1128/genomeA.00571-15. [DOI] [PMC free article] [PubMed] [Google Scholar]
- 32.Devkota S, Wang Y, Musch MW, Leone V, Fehlner-Peach H, Nadimpalli A, Antonopoulos DA, Jabri B, Chang EB. 2012. Dietary-fat-induced taurocholic acid promotes pathobiont expansion and colitis in Il10−/− mice. Nature 487:104–108. doi: 10.1038/nature11225. [DOI] [PMC free article] [PubMed] [Google Scholar]
- 33.Gadelle D, Raibaud P, Sacquet E. 1985. beta-Glucuronidase activities of intestinal bacteria determined both in vitro and in vivo in gnotobiotic rats. Appl Environ Microbiol 49:682–685. [DOI] [PMC free article] [PubMed] [Google Scholar]
- 34.Vitek L, Majer F, Muchova L, Zelenka J, Jiraskova A, Branny P, Malina J, Ubik K. 2006. Identification of bilirubin reduction products formed by Clostridium perfringens isolated from human neonatal fecal flora. J Chromatogr B Analyt Technol Biomed Life Sci 833:149–157. doi: 10.1016/j.jchromb.2006.01.032. [DOI] [PubMed] [Google Scholar]
- 35.Tanaka N, Nonaka T, Tanabe T, Yoshimoto T, Tsuru D, Mitsui Y. 1996. Crystal structures of the binary and ternary complexes of 7 alpha-hydroxysteroid dehydrogenase from Escherichia coli. Biochemistry 35:7715–7730. doi: 10.1021/bi951904d. [DOI] [PubMed] [Google Scholar]
- 36.Imamura T, Sakamoto N, Tamaki M, Hirano S. 1979. Transformation of bile acids by members of the Enterobacteriaceae (author’s transl). Nihon Saikingaku Zasshi 34:513–520. (In Japanese.) doi: 10.3412/jsb.34.513. [DOI] [PubMed] [Google Scholar]
- 37.Schaaf O, Dettner K. 2000. Transformation of steroids by Bacillus strains isolated from the foregut of water beetles (Coleoptera: Dytiscidae). II. Metabolism of 3 beta-hydroxypregn-5-en-20-one (pregnenolone). J Steroid Biochem Mol Biol 75:187–199. doi: 10.1016/S0960-0760(00)00166-7. [DOI] [PubMed] [Google Scholar]
- 38.Rothballer M, Schmid M, Klein I, Gattinger A, Grundmann S, Hartmann A. 2006. Herbaspirillum hiltneri sp. nov., isolated from surface-sterilized wheat roots. Int J Syst Evol Microbiol 56(Pt 6):1341–1348. doi: 10.1099/ijs.0.64031-0. [DOI] [PubMed] [Google Scholar]
- 39.Elsden SR, Hilton MG, Waller JM. 1976. The end products of the metabolism of aromatic amino acids by Clostridia. Arch Microbiol 107:283–288. doi: 10.1007/BF00425340. [DOI] [PubMed] [Google Scholar]
- 40.Wilson DJ, Shi C, Teitelbaum AM, Gulick AM, Aldrich CC. 2013. Characterization of AusA: a dimodular nonribosomal peptide synthetase responsible for the production of aureusimine pyrazinones. Biochemistry 52:926–937. doi: 10.1021/bi301330q. [DOI] [PMC free article] [PubMed] [Google Scholar]
- 41.Layre E, Collmann A, Bastian M, Mariotti S, Czaplicki J, Prandi J, Mori L, Stenger S, De Libero G, Puzo G, Gilleron M. 2009. Mycolic acids constitute a scaffold for mycobacterial lipid antigens stimulating CD1-restricted T cells. Chem Biol 16:82–92. doi: 10.1016/j.chembiol.2008.11.008. [DOI] [PubMed] [Google Scholar]
- 42.Moody DB, Briken V, Cheng TY, Roura-Mir C, Guy MR, Geho DH, Tykocinski ML, Besra GS, Porcelli SA. 2002. Lipid length controls antigen entry into endosomal and nonendosomal pathways for CD1b presentation. Nat Immunol 3:435–442. doi: 10.1038/ni780. [DOI] [PubMed] [Google Scholar]
- 43.Moody DB, Reinhold BB, Guy MR, Beckman EM, Frederique DE, Furlong ST, Ye S, Reinhold VN, Sieling PA, Modlin RL, Besra GS, Porcelli SA. 1997. Structural requirements for glycolipid antigen recognition by CD1b-restricted T cells. Science 278:283–286. doi: 10.1126/science.278.5336.283. [DOI] [PubMed] [Google Scholar]
- 44.Van Rhijn I, Kasmar A, de Jong A, Gras S, Bhati M, Doorenspleet ME, de Vries N, Godfrey DI, Altman J, de Jager W, Rossjohn J, Moody DB. 2013. A conserved human T cell population targets mycobacterial antigens presented by CD1b. Nat Immunol 14:706–713. doi: 10.1038/ni.2630. [DOI] [PMC free article] [PubMed] [Google Scholar]
- 45.Van Domselaar GH, Stothard P, Shrivastava S, Cruz JA, Guo A, Dong X, Lu P, Szafron D, Greiner R, Wishart DS. 2005. BASys: a web server for automated bacterial genome annotation. Nucleic Acids Res 33:W455–W459. doi: 10.1093/nar/gki593. [DOI] [PMC free article] [PubMed] [Google Scholar]
- 46.Sumner LW, Amberg A, Barrett D, Beale MH, Beger R, Daykin CA, Fan TW, Fiehn O, Goodacre R, Griffin JL, Hankemeier T, Hardy N, Harnly J, Higashi R, Kopka J, Lane AN, Lindon JC, Marriott P, Nicholls AW, Reily MD, Thaden JJ, Viant MR. 2007. Proposed minimum reporting standards for chemical analysis. Chemical Analysis Working Group (CAWG) Metabolomics Standards Initiative (MSI). Metabolomics 3:211–221. doi: 10.1007/s11306-007-0082-2. [DOI] [PMC free article] [PubMed] [Google Scholar]
- 47.Caporaso JG, Kuczynski J, Stombaugh J, Bittinger K, Bushman FD, Costello EK, Fierer N, Peña AG, Goodrich JK, Gordon JI, Huttley GA, Kelley ST, Knights D, Koenig JE, Ley RE, Lozupone CA, McDonald D, Muegge BD, Pirrung M, Reeder J, Sevinsky JR, Turnbaugh PJ, Walters WA, Widmann J, Yatsunenko T, Zaneveld J, Knight R. 2010. QIIME allows analysis of high-throughput community sequencing data. Nat Methods 7:335–336. doi: 10.1038/nmeth.f.303. [DOI] [PMC free article] [PubMed] [Google Scholar]
- 48.Protsyuk I, Melnik AV, Nothias LF, Rappez L, Phapale P, Aksenov AA, Bouslimani A, Ryazanov S, Dorrestein PC, Alexandrov T. 2018. 3D molecular cartography using LC-MS facilitated by Optimus and ’ili software. Nat Protoc 13:134–154. doi: 10.1038/nprot.2017.122. [DOI] [PubMed] [Google Scholar]
- 49.Frank AM, Bandeira N, Shen Z, Tanner S, Briggs SP, Smith RD, Pevzner PA. 2008. Clustering millions of tandem mass spectra. J Proteome Res 7:113–122. doi: 10.1021/pr070361e. [DOI] [PMC free article] [PubMed] [Google Scholar]
- 50.Elias JE, Gygi SP. 2007. Target-decoy search strategy for increased confidence in large-scale protein identifications by mass spectrometry. Nat Methods 4:207–214. doi: 10.1038/nmeth1019. [DOI] [PubMed] [Google Scholar]
Associated Data
This section collects any data citations, data availability statements, or supplementary materials included in this article.
Data Availability Statement
The association networks computer code is available on GitHub at https://github.com/mohimanilab/AssociationNetworks.


